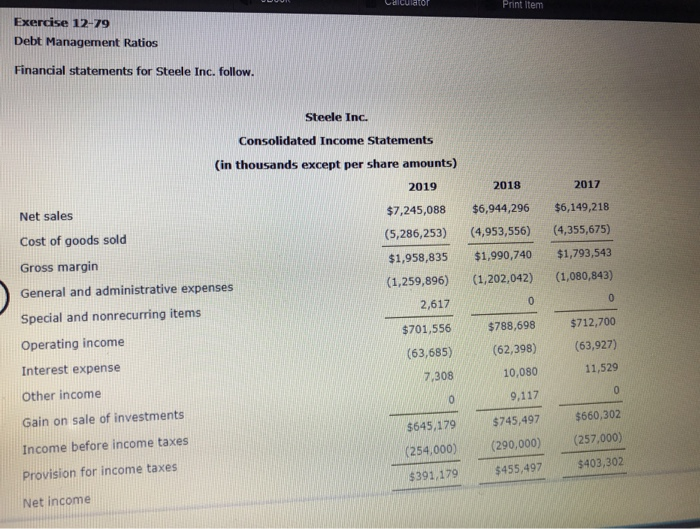
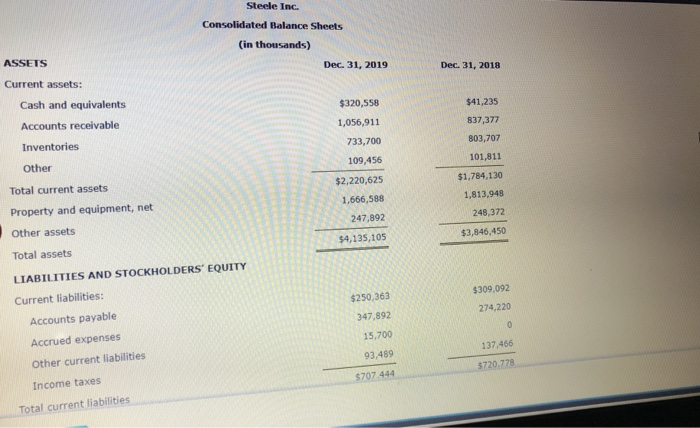
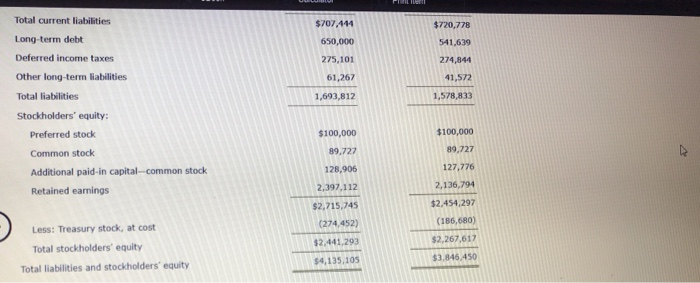
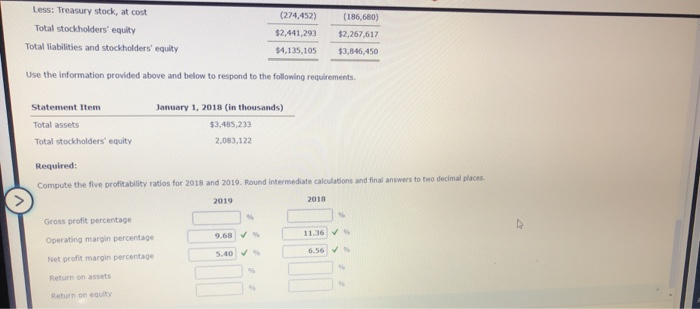
Calculator Print Item Exercise 12-79 Debt Management Ratios Financial statements for Steele Inc. follow. Steele Inc. Consolidated Income Statements (in thousands except per share amounts) 2019 2018 2017 $6,944,296 (4,953,556) $1,990,740 (1,202,042) $6,149,218 (4,355,675) $1,793,543 (1,080,843) Net sales Cost of goods sold Gross margin General and administrative expenses Special and nonrecurring items Operating income Interest expense Other income Gain on sale of investments Income before income taxes Provision for income taxes Net income $7,245,088 (5,286,253) $1,958,835 (1,259,896) 2,617 $701,556 (63,685) 7,308 $788,698 (62,398) 10,080 9,117 $712,700 (63,927) 11,529 $745,497 $660,302 (257,000) $645,179 (254,000) $391,179 (290,000) $455,497 $403,302 Steele Inc. Consolidated Balance Sheets (in thousands) Dec 31, 2019 Dec 31, 2018 ASSETS Current assets: Cash and equivalents $41,235 837,377 Accounts receivable Inventories Other $320,558 1,056,911 733,700 109,456 $2,220,625 1,666,588 247,892 $4,135,105 Total current assets Property and equipment, net 803,707 101,811 $1,784,130 1,813,948 248,372 $3,846,450 Other assets Total assets LIABILITIES AND STOCKHOLDERS' EQUITY Current liabilities: $309,092 274,220 Accounts payable Accrued expenses Other current liabilities $250,363 347,892 15,700 93,489 137.466 $720,778 5707 444 Income taxes Total current liabilities Total current liabilities $720,778 $707.444 650,000 Long-term debt 541,639 Deferred income taxes 275,101 274,844 Other long-term liabilities 41,572 61,267 1,693,812 Total liabilities 1,578,833 Stockholders' equity: Preferred stock Common stock Additional paid-in capital-common stock Retained earnings $100,000 89.727 $100,000 89,727 127,776 2,136,794 128,906 2,397,112 $2.715,745 $2.454.297 (274,452) (186,680) $2.441.203 $2.267.617 Less: Treasury stock, at cost Total stockholders' equity Total liabilities and stockholders' equity $3,846.450 $4,135,105 (274,452) (186,680) Less: Treasury stock, at cost Total stockholders' equity Total liabilities and stockholders' equity $2,441,293 $2,267,617 $4,135,105 $3,846.450 Use the information provided above and below to respond to the following requirements Statement Item January 1, 2018 (in thousands) Total assets $3,485,233 Total stockholders' equity 2,083,122 Required: Compute the five profitability ratios for 2018 and 2019. Round intermediate calculations and final answers to two decimal places 2019 Gross profit percentage Operating margin percentage Net profit margin percentage Return on assets Return on equity