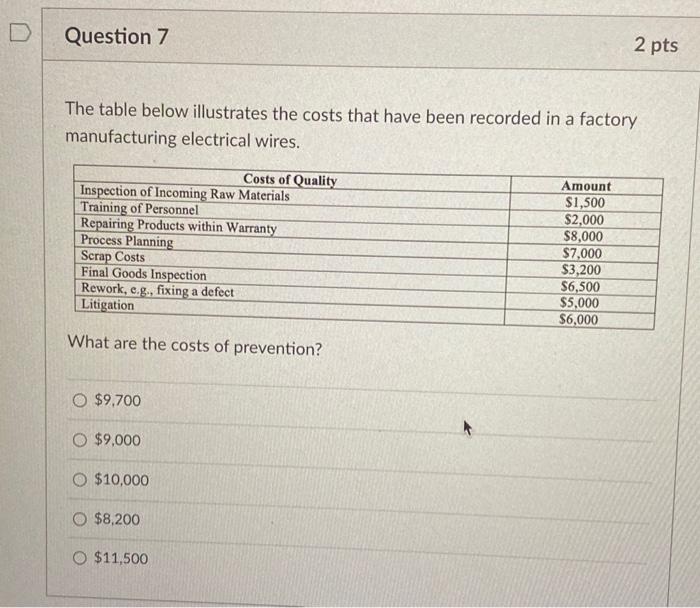
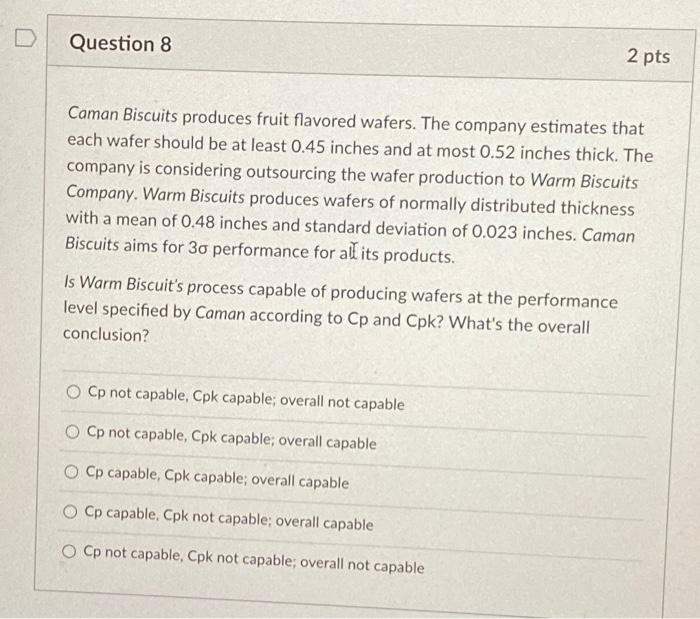
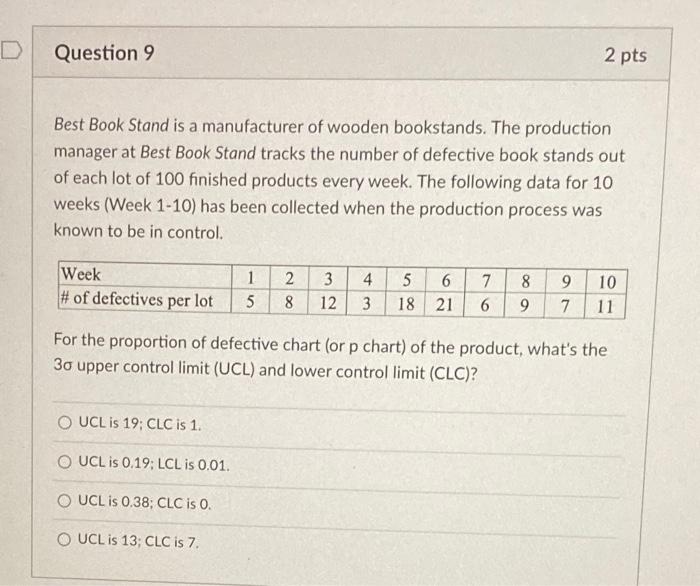
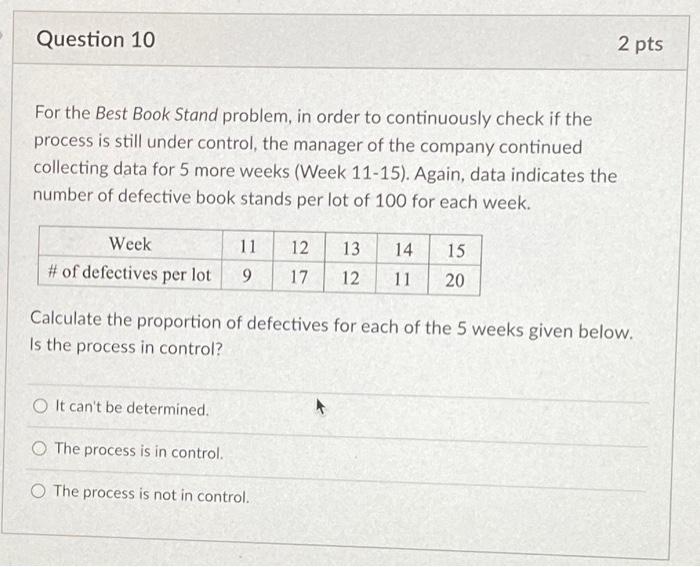
Caman Biscuits produces fruit flavored wafers. The company estimates that each wafer should be at least 0.45 inches and at most 0.52 inches thick. The company is considering outsourcing the wafer production to Warm Biscuits Company. Warm Biscuits produces wafers of normally distributed thickness with a mean of 0.48 inches and standard deviation of 0.023 inches. Caman Biscuits aims for 3 performance for all its products. Is Warm Biscuit's process capable of producing wafers at the performance level specified by Caman according to Cp and Cpk ? What's the overall conclusion? Cp not capable, Cpk capable; overall not capable Cp not capable, Cpk capable; overall capable Cp capable, Cpk capable; overall capable Cp capable, Cpk not capable; overall capable Cp not capable, Cpk not capable; overall not capable The table below illustrates the costs that have been recorded in a factory manufacturing electrical wires. What are the costs of prevention? $9,700 $9,000 $10,000 $8,200 $11,500 Best Book Stand is a manufacturer of wooden bookstands. The production manager at Best Book Stand tracks the number of defective book stands out of each lot of 100 finished products every week. The following data for 10 weeks (Week 1-10) has been collected when the production process was known to be in control. For the proportion of defective chart (or p chart) of the product, what's the 3 upper control limit ( UCL) and lower control limit (CLC)? UCL is 19 ; CLC is 1 . UCL is 0.19 ; LCL is 0.01 . UCL is 0.38 ; CLC is 0 . UCL is 13 ; CLC is 7 . For the Best Book Stand problem, in order to continuously check if the process is still under control, the manager of the company continued collecting data for 5 more weeks (Week 11-15). Again, data indicates the number of defective book stands per lot of 100 for each week. Calculate the proportion of defectives for each of the 5 weeks given below. Is the process in control? It can't be determined. The process is in control. The process is not in control