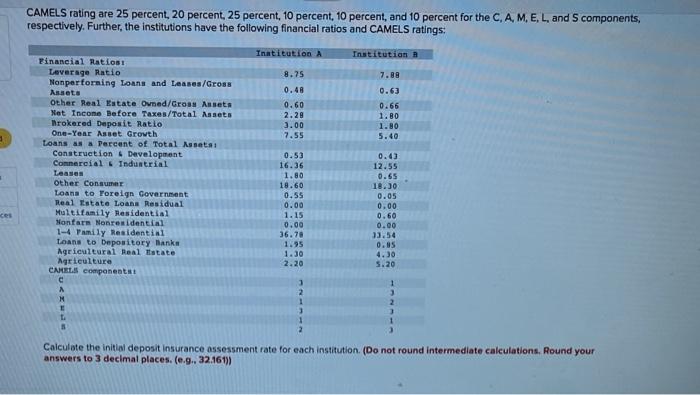
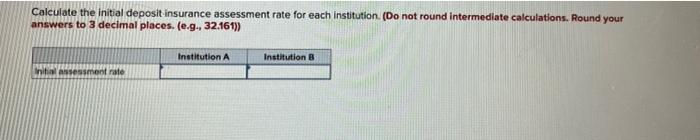
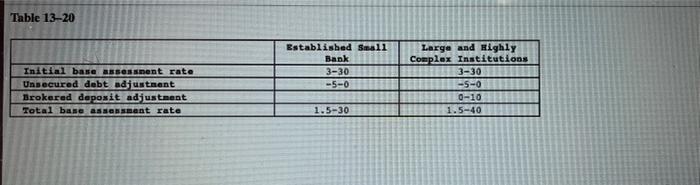
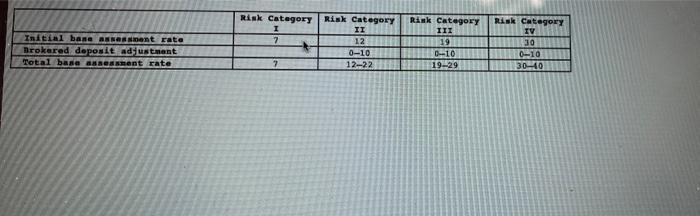
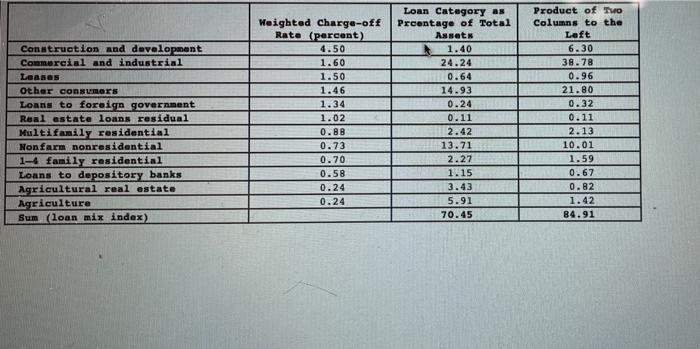
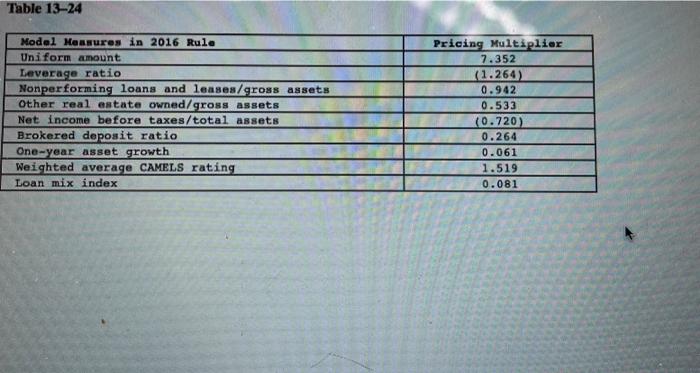
CAMELS rating are 25 percent, 20 percent, 25 percent, 10 percent, 10 percent, and 10 percent for the C, A, M. E, L, and components, respectively. Further, the institutions have the following financial ratios and CAMELS ratings: Institution A Institution 8.25 7.88 0.48 0.63 0.60 2.28 3.00 7.55 0.66 1.80 1.80 5.40 Financial Ratios Leverage Ratio Nonperforming Loans and Leases/Gross Assets Other Real Estate Ovned/Gross Ansets Net Incone Before Taxes/Total Assets Brokered Deposit Ratio One-Year Asset Growth Loans as a percent of Total Assets Construction Development Comercial Tuduntrial Lease Other Consum Loans to Foreign Government Real Estate Loans Residual Multifamily Residential Nontare Nonresidential 1- Pamily Residentini Loans to Depository thanks Agricultural Real Estate Agriculture CAMELS components 0.53 16.36 1.80 18.60 0.55 0.00 1.15 0.00 36.70 1.95 1.30 2.20 0.03 12.55 0.65 18.30 0.05 0.00 0.60 0.00 13.54 0.85 4.30 5.20 ces 1 3 M E 2 1 3 1 2 3 1 3 Calculate the initial deposit Insurance assessment rate for each institution. (Do not round intermediate calculations. Round your answers to 3 decimal places. (e.g.. 32.161)) Calculate the initial deposit insurance assessment rate for each Institution. (Do not round intermediate calculations. Round your answers to 3 decimal places. (e.g., 32.161)) Institution A Institution Initial assessment rate Table 13-20 Established Small Bank 3-30 -5-0 Initial base BSSONnent rate Unsecured debt adjustment Brokerad deposit adjustment Total base assessent rate Large and Righly Complex Institutions 3-30 -5-0 0-10 1.5-40 1.5-30 Risk Category 7 Initial bane AUNGant rate Brokered deposit adjustment Total basa Nement rate Risk Category II 12 0-10 12-22 Rink Category III 19 0--10 19-29 Risk Category IV 30 0-10 3040 2 Construction and development Commercial and industrial Loanes Other consumers Loans to foreign government Real estate loans residual Multifamily residential Non farm nonresidential 1-4 family residential Loans to depository banks Agricultural real estate Agriculture Sum (loan mix index) Weighted Charge-off Rata (percent) 4.50 1.60 1.50 1.46 1.34 1.02 0.88 0.73 0.70 0.58 0.24 0.24 Loan Category as Prcentage of Total Assets 1.40 24.24 0.64 14.93 0.24 0.11 2.42 13.71 2.27 1.15 3.43 5.91 70.45 Product of Turo Columns to the Left 6.30 38.78 0.96 21.80 0.32 0.11 2.13 10.01 1.59 0.67 0.82 1.42 84.91 Table 13-24 Modal Keasures in 2016 Rula Uniform amount Leverage ratio Nonperforming loans and leases/gross assets Other real estate owned/gross assets Net income before taxes/total assets Brokered deposit ratio One-year asset growth Weighted average CAMELS rating Loan mix index Pricing Multiplier 7.352 (1.264) 0.942 0.533 (0.720) 0.264 0.061 1.519 0.081