

Answered step by step
Verified Expert Solution
Question
1 Approved Answer
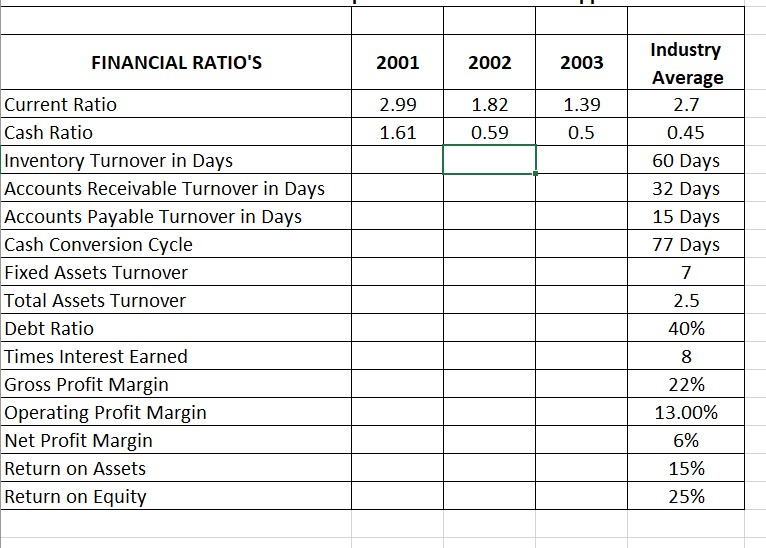
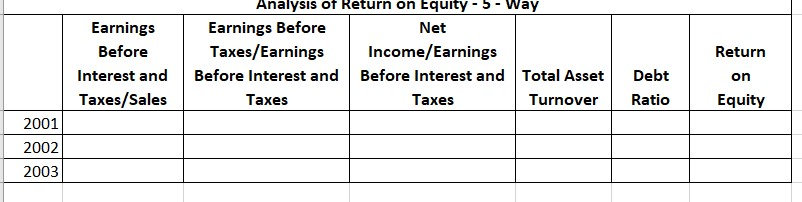
Can anyone fill out the ratio tables at the bottom for me? Thanks. All the information you will need are provided in the financial statements
Can anyone fill out the ratio tables at the bottom for me? Thanks. All the information you will need are provided in the financial statements bellow.
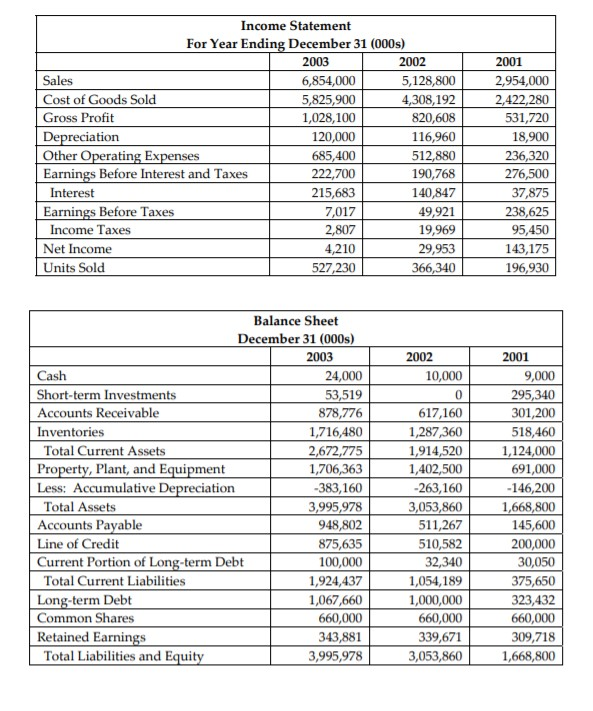
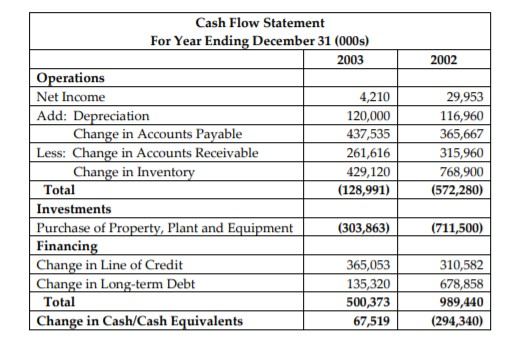
2001 2,954,000 2,422,280 531,720 18,900 Income Statement For Year Ending December 31 (000s) 2003 2002 Sales 6,854,000 5,128,800 Cost of Goods Sold 5,825,900 4,308,192 Gross Profit 1,028,100 820,608 Depreciation 120,000 116,960 Other Operating Expenses 685,400 512,880 Earnings Before Interest and Taxes 222,700 190,768 Interest 215,683 140,847 Earnings Before Taxes I 7,017 Income Taxes 2,807 19,969 Net Income 4,210 29,953 Units Sold 527,230 366,340 236,320 276,500 37,875 238,625 95,450 143,175 196,930 Balance Sheet December 31 (000s) 2003 Cash 24,000 Short-term Investments 53,519 Accounts Receivable 878,776 Inventories 1,716,480 Total Current Assets 2,672,775 Property, Plant, and Equipment 1,706,363 Less: Accumulative Depreciation -383,160 Total Assets 3,995,978 Accounts Payable 948,802 Line of Credit 875,635 Current Portion of Long-term Debt 100,000 Total Current Liabilities 1,924,437 Long-term Debt 1,067,660 Common Shares 660,000 Retained Earnings 343,881 Total Liabilities and Equity 3,995,978 2002 10,000 0 617,160 1,287,360 1,914,520 1,402,500 -263,160 2001 9,000 295,340 301,200 518,460 1,124,000 691,000 -146,200 1,668,800 145,600 200,000 30,050 375,650 323,432 660,000 309,718 1,668,800 511,267 510,582 32,340 1,000,000 660,000 3,053,860 2002 Cash Flow Statement For Year Ending December 31 (000s) 2003 Operations Net Income 4,210 Add: Depreciation 120,000 Change in Accounts Payable 437,535 Less: Change in Accounts Receivable 261,616 Change in Inventory 429,120 Total (128,991) Investments Purchase of Property, Plant and Equipment Financing Change in Line of Credit 365,053 Change in Long-term Debt Total 500,373 Change in Cash/Cash Equivalents 67,519 29,953 116,960 365,667 315,960 768,900 (572,280) 310,582 989,440 (294,340) FINANCIAL RATIO'S 2001 2002 2003 Industry Average 2.7 2.99 1.61 1.82 0.59 1.39 0.5 0.45 60 Days 32 Days 15 Days 77 Days Current Ratio Cash Ratio Inventory Turnover in Days Accounts Receivable Turnover in Days Accounts Payable Turnover in Days Cash Conversion Cycle Fixed Assets Turnover Total Assets Turnover Debt Ratio Times Interest Earned Gross Profit Margin Operating Profit Margin Net Profit Margin Return on Assets Return on Equity 2.5 40% 8 22% 13.00% 6% 15% 25% Earnings Before Interest and Taxes/Sales Analysis of Return on Equity - 5 - Way Earnings Before Net Taxes/Earnings Income/Earnings Before Interest and Before Interest and Total Asset Taxes Taxes Turnover Debt Ratio Return on Equity 2001 2002 2003
Step by Step Solution
There are 3 Steps involved in it
Step: 1

Get Instant Access to Expert-Tailored Solutions
See step-by-step solutions with expert insights and AI powered tools for academic success
Step: 2

Step: 3
Ace Your Homework with AI
Get the answers you need in no time with our AI-driven, step-by-step assistance
Get Started
Finance And Strategy
Authors: Belen Villalonga
1st Edition
1783504935, 978-1783504930