Answered step by step
Verified Expert Solution
Question
1 Approved Answer
Can anyone help me with the ratios? what information is missing? Create a word document and save it as FSAP-Written. Using information contained in the
Can anyone help me with the ratios? 


what information is missing?
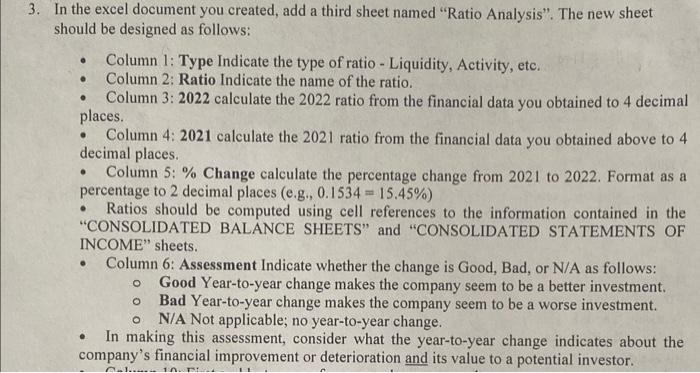
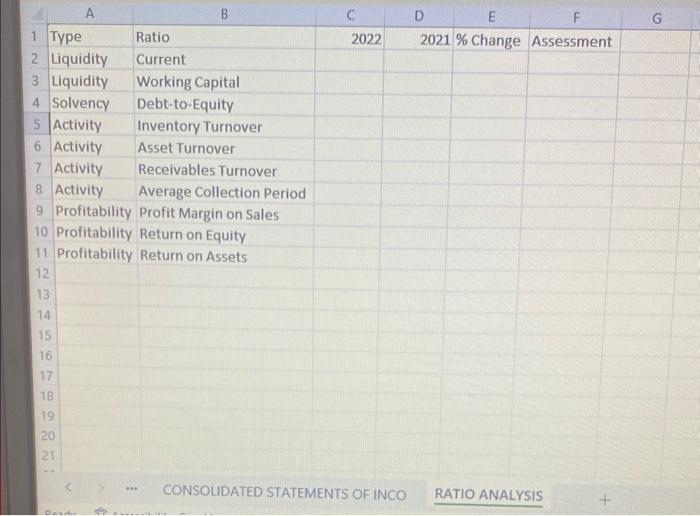
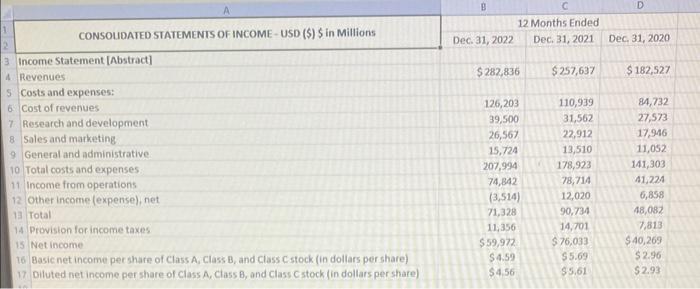
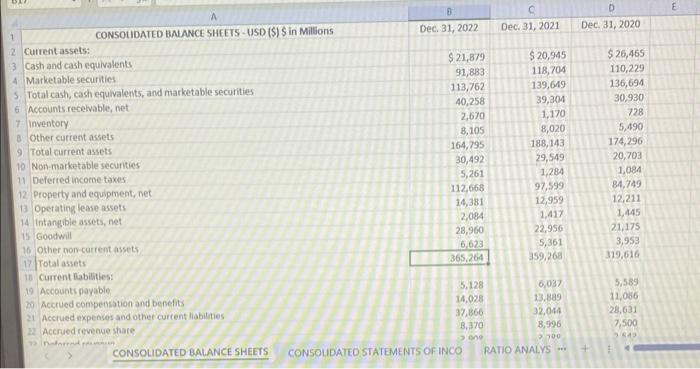
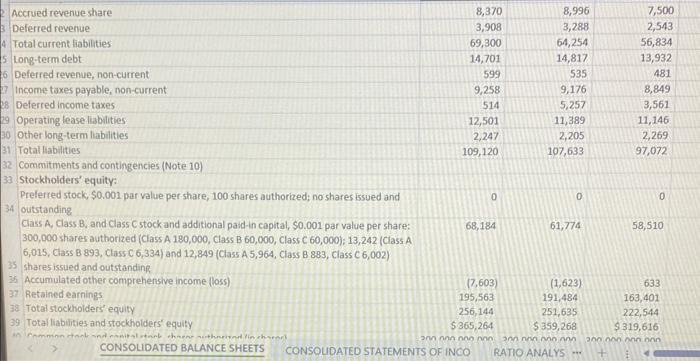
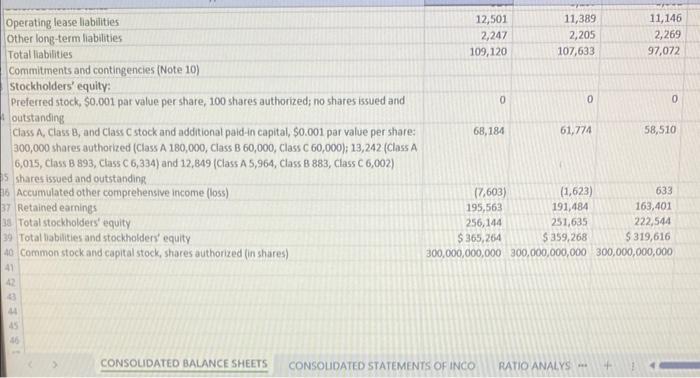
Create a word document and save it as FSAP-Written. Using information contained in the 2022 Annual Report, answer the following questions in complete sentences: a. Summarize the results of your ratio analysis. Which ratio/ratios are most relevant to Alphabet's current financial position? Which ratio/ratios are least relevant? Why? 3. In the excel document you created, add a third sheet named "Ratio Analysis". The new sheet should be designed as follows: - Column 1: Type Indicate the type of ratio-Liquidity, Activity, etc. - Column 2: Ratio Indicate the name of the ratio. - Column 3: 2022 calculate the 2022 ratio from the financial data you obtained to 4 decimal places. - Column 4:2021 calculate the 2021 ratio from the financial data you obtained above to 4 decimal places. - Column 5: \% Change calculate the percentage change from 2021 to 2022 . Format as a percentage to 2 decimal places (e.g., 0.1534=15.45% ) - Ratios should be computed using cell references to the information contained in the "CONSOLIDATED BALANCE SHEETS" and "CONSOLIDATED STATEMENTS OF INCOME" sheets. - Column 6: Assessment Indicate whether the change is Good, Bad, or N/A as follows: - Good Year-to-year change makes the company seem to be a better investment. - Bad Year-to-year change makes the company seem to be a worse investment. - N/A Not applicable; no year-to-year change. - In making this assessment, consider what the year-to-year change indicates about the company's financial improvement or deterioration and its value to a potential investor. 1 CONSOUDATED BALANCE SHEETS - USD (\$) S in Millions \begin{tabular}{c|cc} 8 & C & 0 \\ \hline Dec. 31, 2022 & Dec. 31, 2021 & Dec. 31, 2020 \end{tabular} 2 Current assets: 3 Cash and cash equivalents 4. Marketable securities S. Total cash, cash equivalents, and marketable securities 6. Accounts recelvable, net 7 inventory 8. Other current assets 9. Total current assets 10 Non-marketable securities 11 Deferred incorne taxes 12 Property and equipment, net 13 Operating lease assets 14 intangible assets, net is Goodwill 16 Other non-current assets 17. Total assets 1i. Current liabilities: 19 Accounts payable 20. Accrued compensation and benefits 21 Accrued expenses and other current liabilties 22 Acerued revense share 73 natored resenan CONSOUDATED BALANCE SHEETS CONSOUDATEO STATEMENTS OF INCO RATIO ANALYS Operating lease liabilities Other long-term liabilities Total liabilities Commitments and contingencies (Note 10) Stockholders' equity: Preferred stock, $0.001 par value per share, 100 shares authorized; no shares issued and outstanding Class A, Class B, and Class C stock and additional paid-in capital, $0.001 par value per share: 300,000 shares authorized (Class A 180,000, Class B 60,000, Class C 60,000); 13,242 (Class A 6,015 , Class B 893, Class C 6,334) and 12,849 (Class A 5,964, Class B 883, Class C 6,002) shares issued and outstandink Accumulated other comprehensive income (loss) Retained eamings Total stockholders' equity Total lablities and stockholders' equity Common stock and capital stock, shares authorized (in shares) \begin{tabular}{|r|r|r|} \hline(7,603) & (1,623) & 633 \\ \hline 195,563 & 191,484 & 163,401 \\ 256,144 & 251,635 & 222,544 \\ \hline 365,264 & $359,268 & $319,616 \\ 300,000,000,000 & 300,000,000,000 & 300,000,000,000 \\ \hline \end{tabular} CONSOUDATED BALANCE SHEETS CONSOUDATED STATEMENTS OF INCO RATIO ANALYS .. Create a word document and save it as FSAP-Written. Using information contained in the 2022 Annual Report, answer the following questions in complete sentences: a. Summarize the results of your ratio analysis. Which ratio/ratios are most relevant to Alphabet's current financial position? Which ratio/ratios are least relevant? Why? 3. In the excel document you created, add a third sheet named "Ratio Analysis". The new sheet should be designed as follows: - Column 1: Type Indicate the type of ratio-Liquidity, Activity, etc. - Column 2: Ratio Indicate the name of the ratio. - Column 3: 2022 calculate the 2022 ratio from the financial data you obtained to 4 decimal places. - Column 4:2021 calculate the 2021 ratio from the financial data you obtained above to 4 decimal places. - Column 5: \% Change calculate the percentage change from 2021 to 2022 . Format as a percentage to 2 decimal places (e.g., 0.1534=15.45% ) - Ratios should be computed using cell references to the information contained in the "CONSOLIDATED BALANCE SHEETS" and "CONSOLIDATED STATEMENTS OF INCOME" sheets. - Column 6: Assessment Indicate whether the change is Good, Bad, or N/A as follows: - Good Year-to-year change makes the company seem to be a better investment. - Bad Year-to-year change makes the company seem to be a worse investment. - N/A Not applicable; no year-to-year change. - In making this assessment, consider what the year-to-year change indicates about the company's financial improvement or deterioration and its value to a potential investor. 1 CONSOUDATED BALANCE SHEETS - USD (\$) S in Millions \begin{tabular}{c|cc} 8 & C & 0 \\ \hline Dec. 31, 2022 & Dec. 31, 2021 & Dec. 31, 2020 \end{tabular} 2 Current assets: 3 Cash and cash equivalents 4. Marketable securities S. Total cash, cash equivalents, and marketable securities 6. Accounts recelvable, net 7 inventory 8. Other current assets 9. Total current assets 10 Non-marketable securities 11 Deferred incorne taxes 12 Property and equipment, net 13 Operating lease assets 14 intangible assets, net is Goodwill 16 Other non-current assets 17. Total assets 1i. Current liabilities: 19 Accounts payable 20. Accrued compensation and benefits 21 Accrued expenses and other current liabilties 22 Acerued revense share 73 natored resenan CONSOUDATED BALANCE SHEETS CONSOUDATEO STATEMENTS OF INCO RATIO ANALYS Operating lease liabilities Other long-term liabilities Total liabilities Commitments and contingencies (Note 10) Stockholders' equity: Preferred stock, $0.001 par value per share, 100 shares authorized; no shares issued and outstanding Class A, Class B, and Class C stock and additional paid-in capital, $0.001 par value per share: 300,000 shares authorized (Class A 180,000, Class B 60,000, Class C 60,000); 13,242 (Class A 6,015 , Class B 893, Class C 6,334) and 12,849 (Class A 5,964, Class B 883, Class C 6,002) shares issued and outstandink Accumulated other comprehensive income (loss) Retained eamings Total stockholders' equity Total lablities and stockholders' equity Common stock and capital stock, shares authorized (in shares) \begin{tabular}{|r|r|r|} \hline(7,603) & (1,623) & 633 \\ \hline 195,563 & 191,484 & 163,401 \\ 256,144 & 251,635 & 222,544 \\ \hline 365,264 & $359,268 & $319,616 \\ 300,000,000,000 & 300,000,000,000 & 300,000,000,000 \\ \hline \end{tabular} CONSOUDATED BALANCE SHEETS CONSOUDATED STATEMENTS OF INCO RATIO ANALYS Step by Step Solution
There are 3 Steps involved in it
Step: 1

Get Instant Access to Expert-Tailored Solutions
See step-by-step solutions with expert insights and AI powered tools for academic success
Step: 2

Step: 3

Ace Your Homework with AI
Get the answers you need in no time with our AI-driven, step-by-step assistance
Get Started


