Can anyone tell me where to find 2016 competition or industry ratios for Tootsie Roll Industries ?? *Needs to include reference*
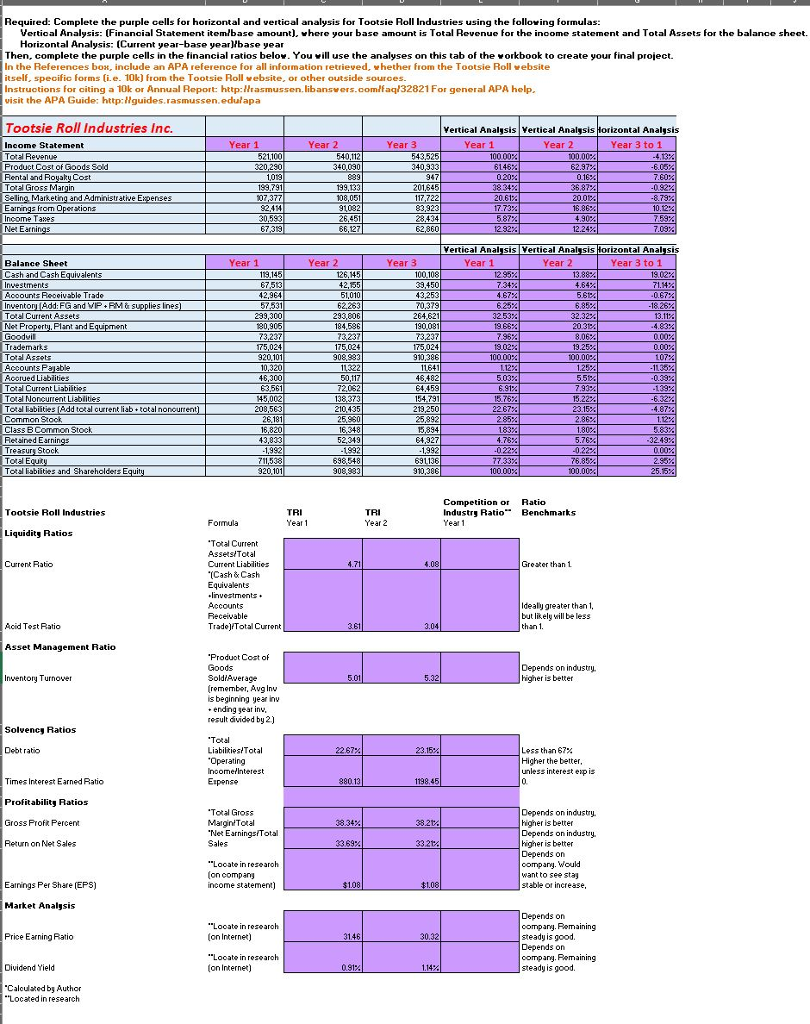
Required: Complete the purple cells for horizontal and vertical analysis for Tootsie Roll Industries using the following formulas: Vertical Analysis: (Finanoial Statement itemlbase amount), where your base amount is Total Revenue for the inoorme statement and Total Assets for the balance sheet. Horizontal Analysis: Current year-base yearMbase year Then, complete the purple cells in the financial ratios below. You will use the analyses on this tab of the workbook to create your final project. n the References box, include an APA reference for all information re eyed, whether from the Tootsie Roll website e. 10k) he T tsie Roll website, or other outside visit the APA Guide: http: Annual Report: edulapa "en libansvers.com/faq132821For ge guides rasmussen http: al APA help. Inc verticalAnalisis Mertical Anassis otsie Roll Indu izontal Anal ear 1 wear Year 3 ear 1 Year 2 Year 3 to 1 Stat Revenue 2100 F40.12 43525 Froduct cost oGoods Sod 300, 230 340,080 340,933 Rental and RoyakyCost 1019 E39 337 02024 016AL Tot Gros Margin S9731 99.13 2011545 20.6124 -8 9244 9109 83,923 come Taxe 129224 12.244 7034 Net 67,319 66,12 verticaAnal Sis Vertical Anal sis ontal Ana ear 1 Year 2 Year 3 Year 1 Wear 2 Year 3 to 1 Sh 129524 13884 190224 Cash and Cash E alents 67513 42,15! 39,450 66124 40672A 6224 58524 -18 Toalcurrent Assets 239 300 293 506 264 621 325324 323224 19662 20324 Trademark 175,024 15024 175024 19022 192524 0.00% To Assets g 2011 908983 Accounts Palable 320 132 Accrued Liabilities 16300 5017l 46482 Total Noncurrent Liblite 5,002 833 91 ToAaIabilities Addtotalcurent Diab totalnomourrentl 200,53 210,35 l 219250 Common 26181 25930 25892 Class eCommon Stock 15.820 16 348 894 18324 18024 51834 IResained Earningsl 13.030 52319 57623 7332 76 2954 TotalMabilities and Shareholder Equity 20101 908 1000024 100.00 25.5% Comp Rati Tootsie Roll Industries Industry Ratio Benchmarks Formula Year 2 Year Liquidity Rati "Total Curren Assets Tot Current Ratio Current Liabili sh & Cash Equivalents Accounts dealy greater Receivable but lik. will be less adelfT 3.61 sset Management Ratio Produot Cost Goods Depends o n industry. inventory T Sold higher is better ber, Avg is beginning ye ar in endin esult divider Solvency Ratios otal stTot Less an 67% operating Higher the bett etInteres st exp Times Interest Earned Ratio Expense Profitability R "Total Gross Depends on industry. Gross Profit Percent Margin Total higher is better Net E gsiT Depend dustry. Return on Net Sales Sales Higher is better Depends o company. o see stay on compan, Earrings Per Share (EPS income st ment) stable or increase, Market Analysis Depends o company. Rel Price Earning Ratio steady is good on Internet) Depends on company. Rel Dividend Yield 091% on Internet stea ulated Aut Located in research