Can i get answers of all the questions please?
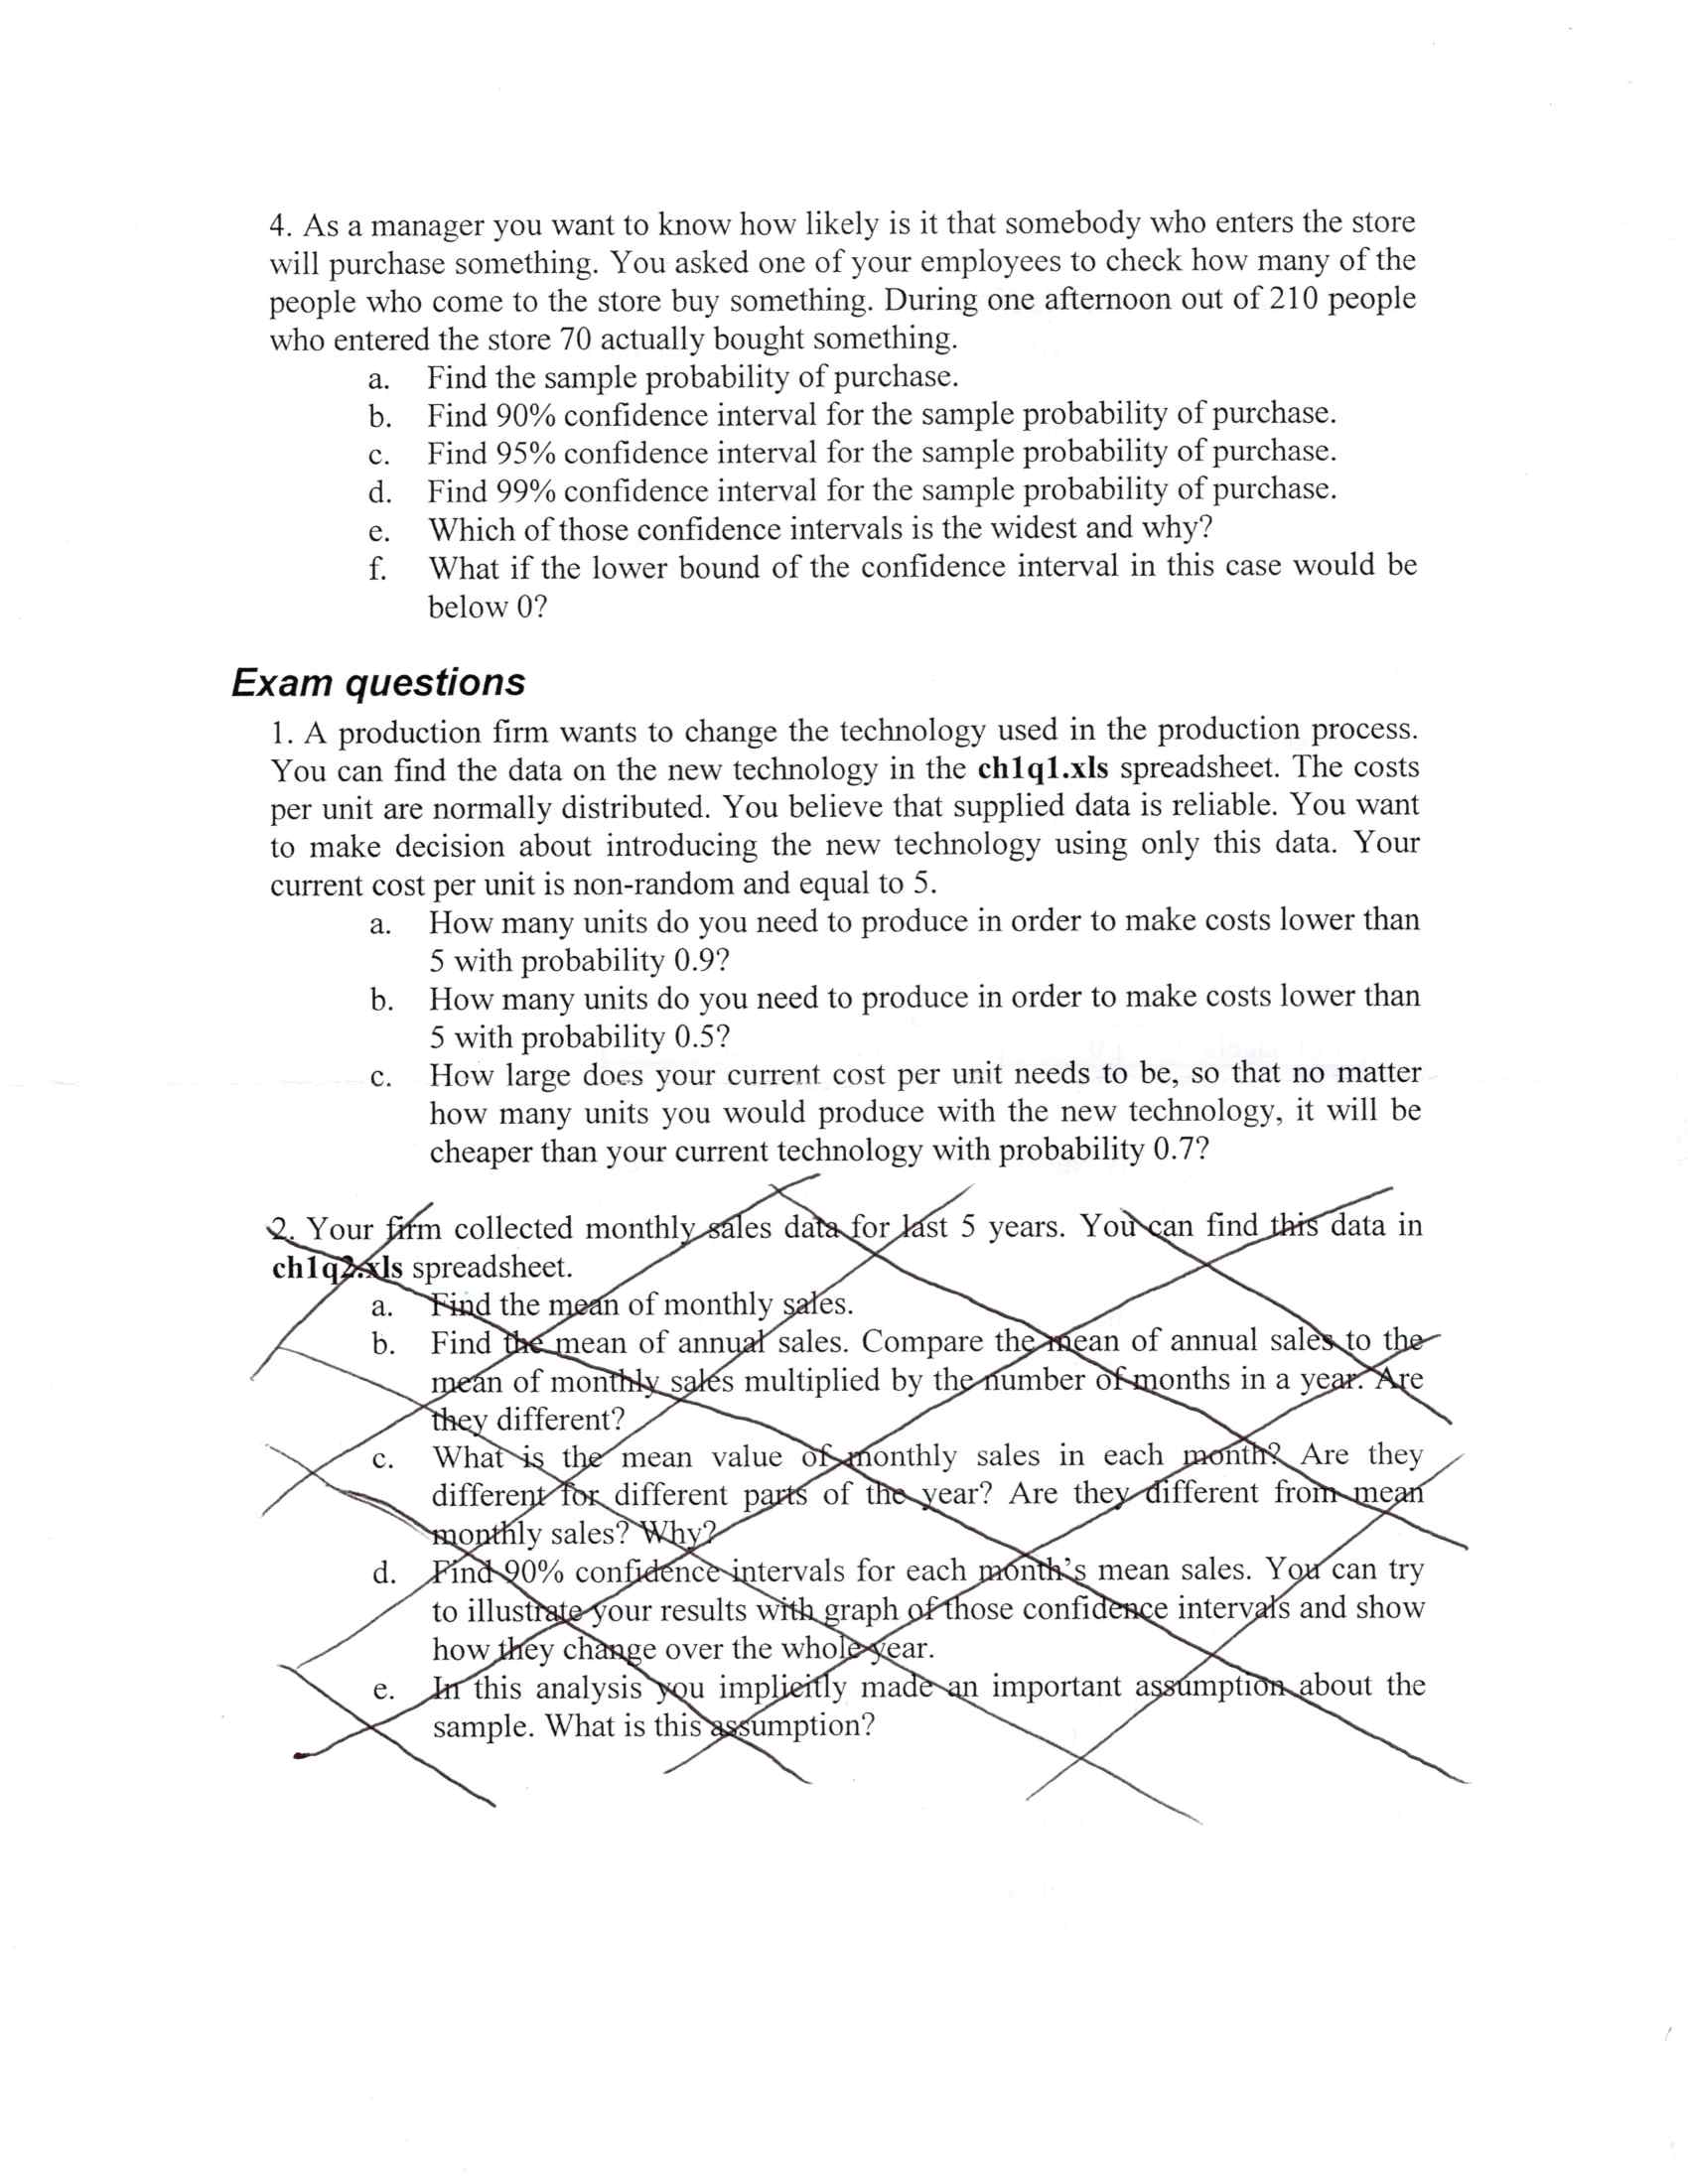
4. As a manager you want to know how likely is it that somebody who enters the store will purchase something. You asked one of your employees to check how many of the people who come to the store buy something. During one afternoon out of 210 people who entered the store 70 actually bought something. a. Find the sample probability of purchase. b. Find 90% confidence interval for the sample probability of purchase. C. Find 95% confidence interval for the sample probability of purchase. d. Find 99% confidence interval for the sample probability of purchase. e . f . Which of those confidence intervals is the widest and why? What if the lower bound of the confidence interval in this case would be below 0? Exam questions 1. A production firm wants to change the technology used in the production process. You can find the data on the new technology in the chlql.xIs spreadsheet. The costs per unit are normally distributed. You believe that supplied data is reliable. You want to make decision about introducing the new technology using only this data. Your current cost per unit is non-random and equal to 5. a. How many units do you need to produce in order to make costs lower than 5 with probability 0.9? b. How many units do you need to produce in order to make costs lower than 5 with probability 0.5? C. How large does your current cost per unit needs to be, so that no matter how many units you would produce with the new technology, it will be cheaper than your current technology with probability 0.7? 2. Your firm collected monthly sales data for last 5 years. You can find this data in chlq2. Is spreadsheet. a. Find the mean of monthly sales. b. Find the mean of annual sales. Compare the mean of annual sales to the mean of monthly sales multiplied by the number of months in a year. Are they different? C. What is the mean value of monthly sales in each month? Are they different for different parts of the year? Are they different from mean monthly sales? Why? d. Find 90% confidence intervals for each month's mean sales. You can try to illustrate your results with graph of those confidence intervals and show how they change over the whole year. e . In this analysis you implieitly made an important assumption about the sample. What is this assumption


