Answered step by step
Verified Expert Solution
Question
1 Approved Answer
Can I have help calculating Tesla's accounts receivable turnover, debt, debt to equity, and times-interest-earned ratios? Here is their balance sheet: Here is their income
Can I have help calculating Tesla's accounts receivable turnover, debt, debt to equity, and times-interest-earned ratios?
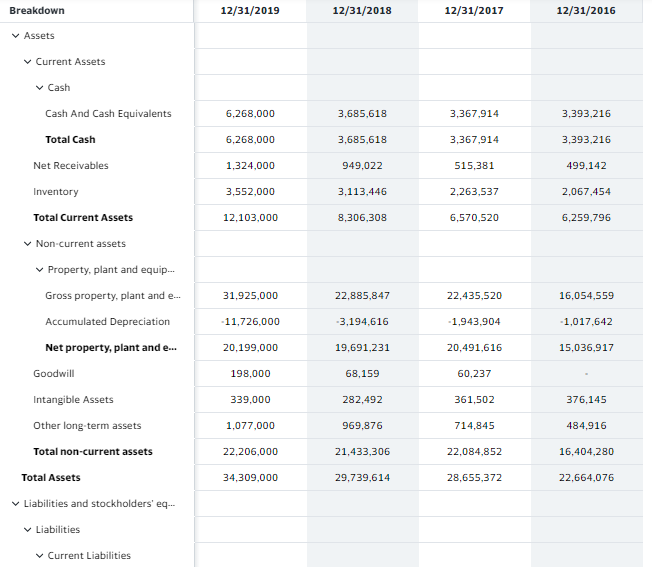
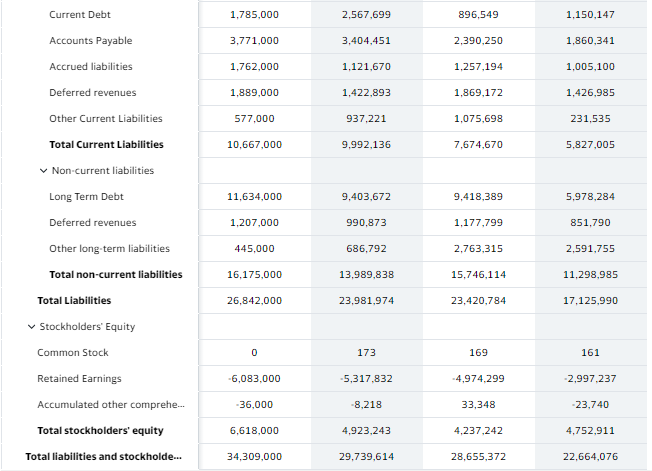
Here is their balance sheet:


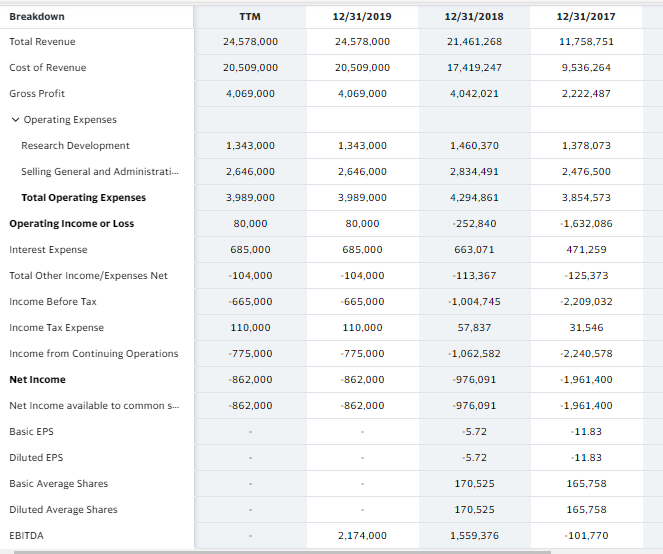
Here is their income statement:

Breakdown 12/31/2019 12/31/2018 12/31/2017 12/31/2016 Assets Current Assets Cash Cash And Cash Equivalents 6,268,000 3,685,618 3,367,914 3,393,216 Total Cash 6,268,000 3,685,618 3,367,914 3,393,216 Net Receivables 1,324,000 949,022 515,381 499,142 Inventory 3,552,000 3,113,446 2,263,537 2,067,454 Total Current Assets 12,103,000 8,306,308 6,570,520 6.259.796 Non-current assets Property, plant and equip... Gross property, plant and e.. 31,925,000 22,885,847 22,435,520 16,054,559 Accumulated Depreciation 11,726.000 -3,194,616 1,943,904 -1,017,642 Net property, plant and e... 20.199,000 19,691,231 20,491,616 15,036,917 Goodwill 198,000 68,159 60,237 Intangible Assets 339,000 282,492 361,502 376,145 Other long-term assets 1,077,000 969,876 714,845 484,916 Total non-current assets 22,206,000 21,433,306 22,084,852 16.404,280 Total Assets 34,309,000 29.739,614 28.655,372 22,664,076 Liabilities and stockholders' eq... Liabilities Current Liabilities Current Debt 1,785,000 2.567,699 896,549 1,150,147 Accounts Payable 3.771,000 3,404,451 2,390,250 1,860.341 Accrued liabilities 1,762,000 1,121,670 1,257,194 1,005.100 Deferred revenues 1,889,000 1,422,893 1,869,172 1,426,985 Other Current Liabilities 577,000 937,221 1,075,698 231.535 Total Current Liabilities 10,667,000 9.992,136 7.674,670 5,827,005 Non-current liabilities Long Term Debt 11,634,000 9,403,672 9,418,389 5.978,284 Deferred revenues 1,207,000 990,873 1,177,799 851,790 Other long-term liabilities 445.000 686,792 2.763,315 2,591,755 Total non-current liabilities 16,175,000 13,989,838 15,746,114 11,298,985 Total Liabilities 26,842,000 23,981,974 23,420,784 17,125,990 Stockholders' Equity Common Stock 173 169 161 Retained Earnings -6,083.000 -5,317,832 -4,974.299 -2,997.237 Accumulated other comprehe.. -36,000 -8,218 33,348 -23,740 Total stockholders' equity 6,618,000 4,923,243 4,237,242 4,752,911 Total liabilities and stockholde... 34,309,000 29,739,614 28,655,372 22,664,076 Breakdown TTM 12/31/2019 12/31/2018 12/31/2017 Total Revenue 24,578,000 24,578,000 21,461,268 11.758,751 Cost of Revenue 20,509,000 20,509,000 17,419,247 9,536,264 Gross Profit 4,069,000 4,069,000 4,042,021 2,222,487 Operating Expenses Research Development 1,343,000 1.343,000 1,460,370 1,378,073 Selling General and Administrati... 2,646,000 2,646,000 2,834,491 2,476,500 Total Operating Expenses 3.989,000 3,989,000 4,294,861 3,854,573 Operating Income or Loss 80,000 80,000 -252,840 -1,632,086 Interest Expense 685,000 685.000 663,071 471,259 Total Other Income/Expenses Net -104,000 -104,000 -113,367 -125,373 Income Before Tax -665,000 -665,000 1,004,745 -2,209,032 Income Tax Expense 110,000 110,000 57,837 31.546 Income from Continuing Operations -775,000 -775,000 -1,062.582 -2,240.578 Net Income -862,000 -862,000 -976,091 1,961,400 Net Income available to common s... -862,000 -862,000 -976,091 1,961,400 Basic EPS -5.72 11.83 Diluted EPS -5.72 11.83 Basic Average Shares 170,525 165,758 Diluted Average Shares 170,525 165,758 EBITDA 2,174,000 1,559,376 -101,770
Step by Step Solution
There are 3 Steps involved in it
Step: 1

Get Instant Access to Expert-Tailored Solutions
See step-by-step solutions with expert insights and AI powered tools for academic success
Step: 2

Step: 3

Ace Your Homework with AI
Get the answers you need in no time with our AI-driven, step-by-step assistance
Get Started


