Answered step by step
Verified Expert Solution
Question
1 Approved Answer
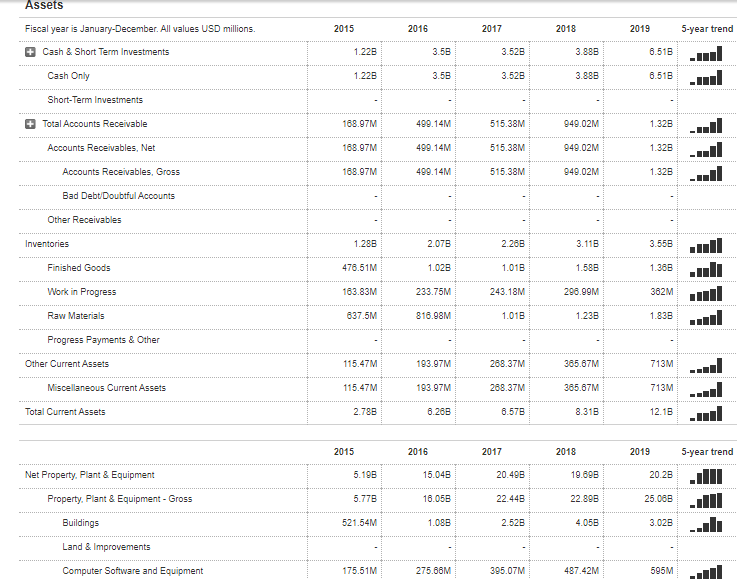
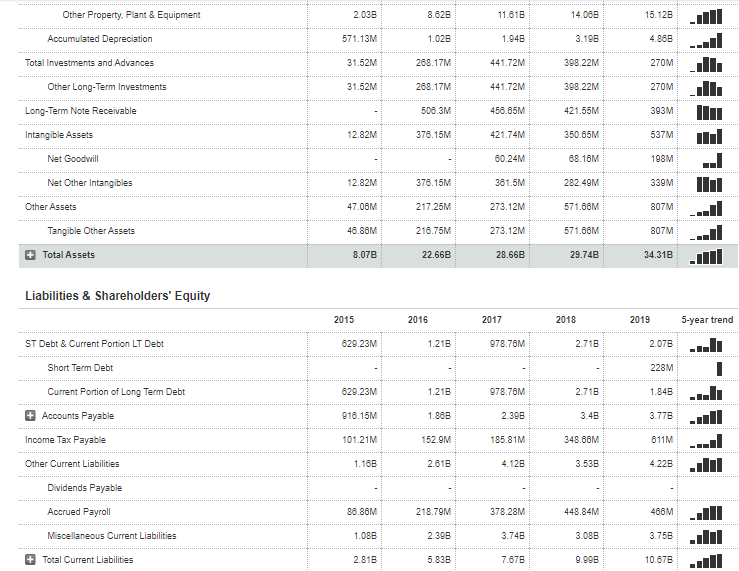
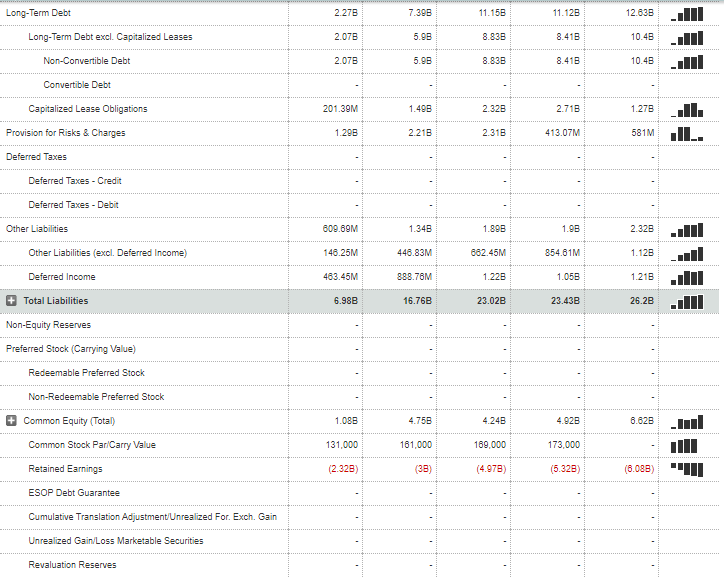
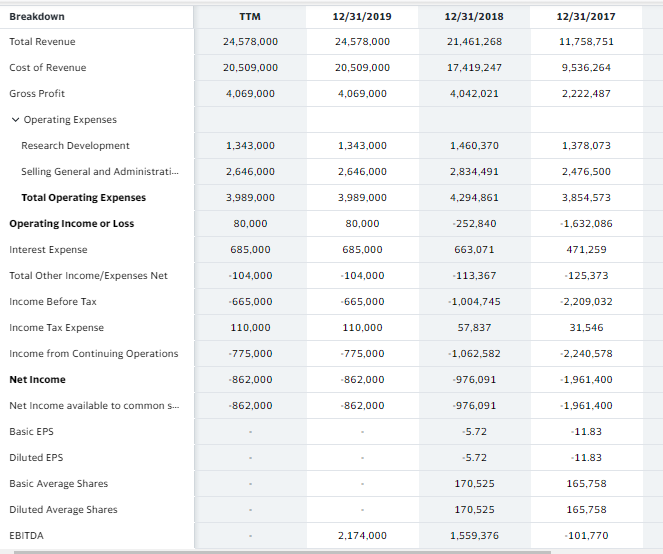
Can I have help calculating Tesla's cash, acid-test, current, and inventory turnover ratios? Here is their balance sheet: Here is their income statement: Thank you
Can I have help calculating Tesla's cash, acid-test, current, and inventory turnover ratios?
Here is their balance sheet:


Here is their income statement:

Thank you for any help!
Assets Fiscal year is January-December. All values USD millions 2018 2015 1.228 1.225 2016 3 Cash & Short Term Investments 2017 3.528 3.528 .58 3.50 3.888 2019 8.518 8.518 5-year trend un u Cash Only 3.888 Short-Term Investments Total Accounts Receivable 168.97M Accounts Receivables. Net 168.97M 499.14M 499.14M 499.14M 5 515.38M 15.38M 515.38M 949.02M 949.02M 949.02M Accounts Receivables. Gross 168.97M Bad Debt Doubtful Accounts Other Receivables Inventories 1.288 2.288 3.118 3.560 ull Finished Goods 476 51M 1.013 1.588 1.36B 2.078 1.028 233.75M 816.98M Work in Progress 296.99M 163.83M 837.5M 243.18M 1.018 362M 1838 Raw Materials 1.238 .. Progress Payments & Other Other Current Assets 115.47M 193.97M 365.67M Miscellaneous Current Assets 193.97M 288.37M 288.37M 6.578 115.47M 2.788 365.67M 713M 713M 12.15 ... .. uul Total Current Assets 6.268 8.318 2015 5-year trend 2016 15.048 2017 20.498 2018 19.898 Net Property. Plant & Equipment 5.198 2019 20.28 25.068 3.028 Property. Plant & Equipment - Gross 5.778 22.898 Jul 16.058 1.088 22.448 2.528 Buildings 521.54M 4.058 Land & Improvements Computer Software and Equipment 175.511M 275.86M 305.07M 487.42M 595M Other Property. Plant & Equipment 2.038 11.618 14.068 8.628 1.02B 15.125 4.888 Accumulated Depreciation 571.13M 1.948 3.198 Total Investments and Advances 31.52M 288.17M 441.72M 398.22M 270M Other Long-Term Investments 31.52M 288.17M 398.22M 270M Long-Term Note Receivable 421.55M 393M 508.3M 376.15M Intangible Assets 12.82M 350.65M 537M Net Goodwill 198M 441.72M 458.65M 421.74M 80.24M 381.5M 273.12M 273.12M 28.668 Net Other Intangibles 12.82M 378.15M 339M Other Assets 47.06M 217.25M 68.16M 282.49M 571.68M 571.86M 29.74B 807M Tangible Other Assets 48.86M 218.75M 807M 34.318 Total Assets 8.07B 22.56B il Liabilities & Shareholders' Equity 2015 2016 1.218 2017 978.76M 2018 2.718 5-year trend ...i ST Debt & Current Portion LT Debt 629.23 Short Term Debt Current Portion of Long Term Debt 829.23M 1.21B 978.76M 2.308 2.718 3.48 2019 2.078 228M 1.848 3.778 611M 4.228 Accounts Payable 916.15M 1.888 Income Tax Payable 101 21M 152.9M 2.618 185.81M 4.128 348.66M 3.538 Other Current Liabilities 1.168 Dividends Payable Accrued Payroll g5.83M 218.79M 378.28M 448.84M 486M Miscellaneous Current Liabilities 1.088 2.398 3.75B 3.748 7.878 3.088 9.998 Total Current Liabilities 2.818 5.838 10.878 ull Long-Term Debt 7.39B 11.158 ,JII Long-Term Debt excl. Capitalized Leases 2.278 2.078 2.078 8.838 8.838 11.128 8.418 8.418 12.835 10.48 10.48 Non-Convertible Debt Convertible Debt Capitalized Lease Obligations 201.39M 1298 1.400 2218 2.328 2.31B 2.718 413.07M 1278 581M Il IL. Provision for Risks & Charges Deferred Taxes Deferred Taxes - Credit Deferred Taxes - Debit Other Liabilities 609.69M 1.348 1.898 1.98 Jul Other Liabilities (excl. Deferred Income) 146.25M 448.83M 854.81M 882.45M 1.228 2.325 1.128 1.218 26.2B Deferred Income 463.45M 888.76M 16.76B 1.05 23.43B + Total Liabilities 6.98B 23.02B ulll Non-Equity Reserves Preferred Stock (Carrying Value) Redeemable Preferred Stock Non-Redeemable Preferred Stock Common Equity (Total) Common Stock Par Carry Value 1.085 4.758 4.925 131.000 161.000 4.248 169,000 (4.978) 173,000 Retained Earnings (2.328) (5.328) (6.088) 1 ESOP Debt Guarantee Cumulative Translation Adjustment/Unrealized For Exch. Gain Unrealized Gain/Loss Marketable Securities Revaluation Reserves Treasury Stock # Total Shareholders' Equity 1.085 4.75B 4.248 4.92B Accumulated Minority Interest 1.15B 1.39B 1.498 Total Equity 5.91B 1.48 5.638 28.66B 1.088 8.07B 6.31B 8.118 Mill 34.31Bull Liabilities & Shareholders' Equity 22.66B 29.74B Copyright 2020 FactSet Research Systems Inc. All rights reserved. Source FactSet Fundamentals. Breakdown TTM 12/31/2019 12/31/2018 12/31/2017 Total Revenue 24,578,000 24,578,000 21,461,268 11.758,751 Cost of Revenue 20,509,000 20,509,000 17,419,247 9,536,264 Gross Profit 4,069,000 4,069,000 4,042,021 2,222,487 Operating Expenses Research Development 1,343,000 1.343,000 1,460,370 1,378,073 Selling General and Administrati... 2,646,000 2,646,000 2,834,491 2,476,500 Total Operating Expenses 3.989,000 3,989,000 4,294,861 3,854,573 Operating Income or Loss 80,000 80,000 -252,840 -1,632,086 Interest Expense 685,000 685.000 663,071 471,259 -104,000 -104,000 -113,367 -125,373 Income Before Tax -665,000 -665,000 1,004,745 -2,209,032 Income Tax Expense 110,000 110,000 57,837 31.546 Income from Continuing Operations -775,000 -775,000 -1,062.582 -2,240.578 Net Income -862,000 -862,000 -976,091 1,961,400 Net Income available to common s... -862,000 -862,000 -976,091 1,961,400 Basic EPS -5.72 11.83 Diluted EPS -5.72 11.83 Basic Average Shares 170,525 165,758 Diluted Average Shares 170,525 165,758 EBITDA 2,174,000 1,559,376 -101,770Step by Step Solution
There are 3 Steps involved in it
Step: 1

Get Instant Access to Expert-Tailored Solutions
See step-by-step solutions with expert insights and AI powered tools for academic success
Step: 2

Step: 3

Ace Your Homework with AI
Get the answers you need in no time with our AI-driven, step-by-step assistance
Get Started


