Answered step by step
Verified Expert Solution
Question
1 Approved Answer
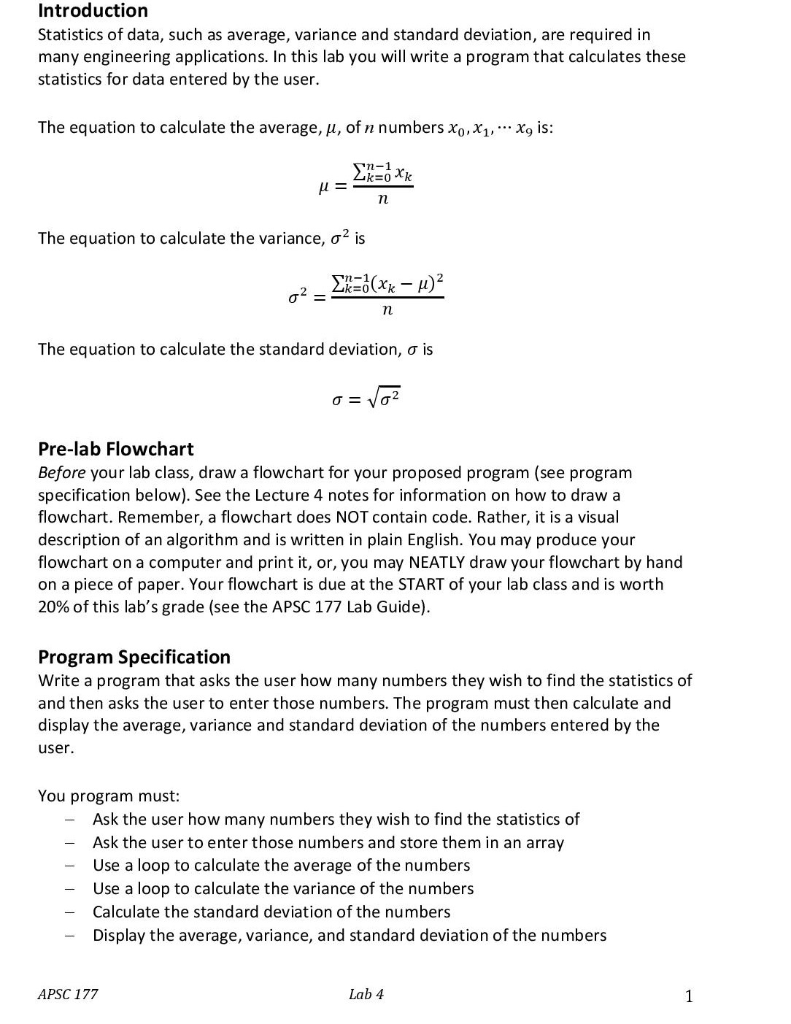
Can somebody please help me with just the flow chart? Introduction Statistics of data, such as average, variance and standard deviation, are required in many

Can somebody please help me with just the flow chart?
Introduction Statistics of data, such as average, variance and standard deviation, are required in many engineering applications. In this lab you will write a program that calculates these statistics for data entered by the user. The equation to calculate the average, u, of n numbers X0,X1, ** X, is: n-1 U = Lk=0 n The equation to calculate the variance, od is =/(xk u)? n The equation to calculate the standard deviation, o is o= Voz Pre-lab Flowchart Before your lab class, draw a flowchart for your proposed program (see program specification below). See the Lecture 4 notes for information on how to draw a flowchart. Remember, a flowchart does NOT contain code. Rather, it is a visual description of an algorithm and is written in plain English. You may produce your flowchart on a computer and print it, or, you may NEATLY draw your flowchart by hand on a piece of paper. Your flowchart is due at the START of your lab class and is worth 20% of this lab's grade (see the APSC 177 Lab Guide). Program Specification Write a program that asks the user how many numbers they wish to find the statistics of and then asks the user to enter those numbers. The program must then calculate and display the average, variance and standard deviation of the numbers entered by the user. You program must: - Ask the user how many numbers they wish to find the statistics of - Ask the user to enter those numbers and store them in an array - Use a loop to calculate the average of the numbers - Use a loop to calculate the variance of the numbers - Calculate the standard deviation of the numbers - Display the average, variance, and standard deviation of the numbers APSC 177 Lab 4 Introduction Statistics of data, such as average, variance and standard deviation, are required in many engineering applications. In this lab you will write a program that calculates these statistics for data entered by the user. The equation to calculate the average, u, of n numbers X0,X1, ** X, is: n-1 U = Lk=0 n The equation to calculate the variance, od is =/(xk u)? n The equation to calculate the standard deviation, o is o= Voz Pre-lab Flowchart Before your lab class, draw a flowchart for your proposed program (see program specification below). See the Lecture 4 notes for information on how to draw a flowchart. Remember, a flowchart does NOT contain code. Rather, it is a visual description of an algorithm and is written in plain English. You may produce your flowchart on a computer and print it, or, you may NEATLY draw your flowchart by hand on a piece of paper. Your flowchart is due at the START of your lab class and is worth 20% of this lab's grade (see the APSC 177 Lab Guide). Program Specification Write a program that asks the user how many numbers they wish to find the statistics of and then asks the user to enter those numbers. The program must then calculate and display the average, variance and standard deviation of the numbers entered by the user. You program must: - Ask the user how many numbers they wish to find the statistics of - Ask the user to enter those numbers and store them in an array - Use a loop to calculate the average of the numbers - Use a loop to calculate the variance of the numbers - Calculate the standard deviation of the numbers - Display the average, variance, and standard deviation of the numbers APSC 177 Lab 4Step by Step Solution
There are 3 Steps involved in it
Step: 1

Get Instant Access to Expert-Tailored Solutions
See step-by-step solutions with expert insights and AI powered tools for academic success
Step: 2

Step: 3

Ace Your Homework with AI
Get the answers you need in no time with our AI-driven, step-by-step assistance
Get Started


