

Answered step by step
Verified Expert Solution
Question
1 Approved Answer
can somebody please help me with this procedure?? I completed table 1 but I'm not sure if I graphed it correct DENSITY AND GRAPHING PRE-LAB
can somebody please help me with this procedure?? I completed table 1 but I'm not sure if I graphed it correct 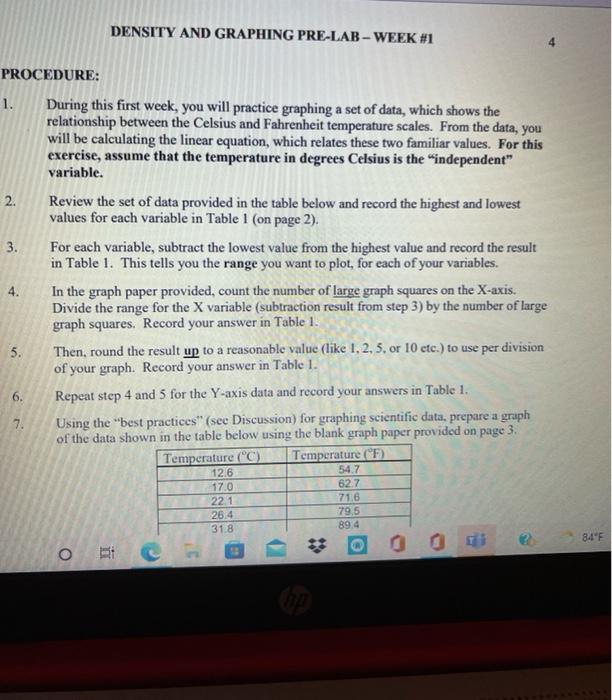
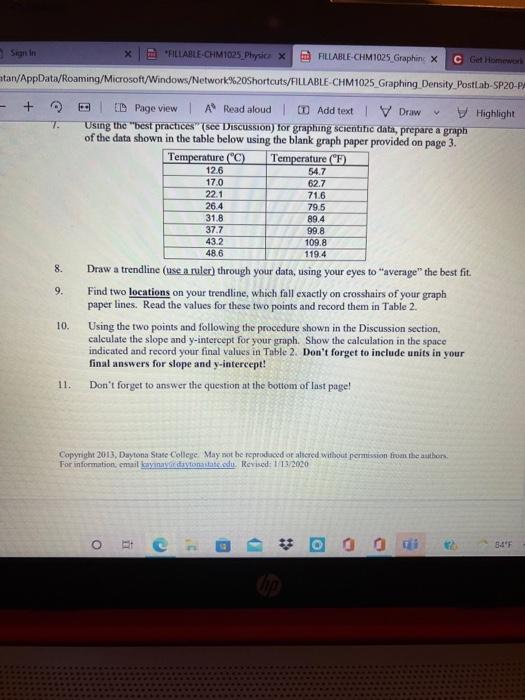
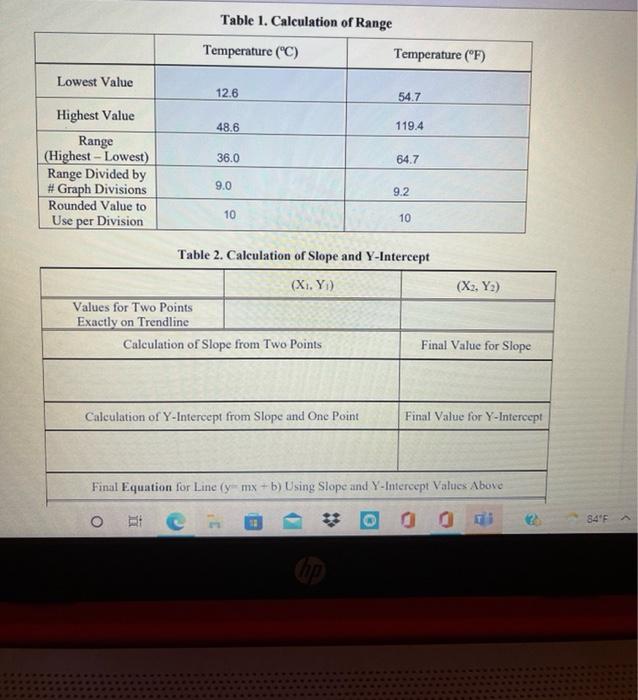
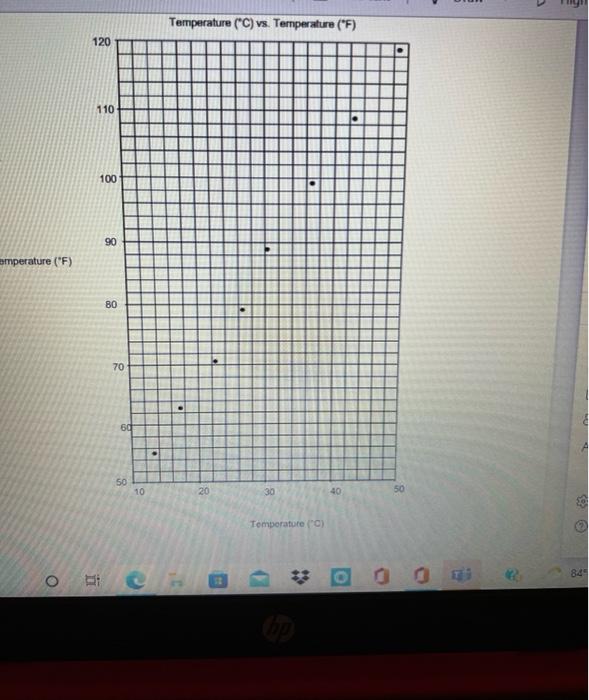
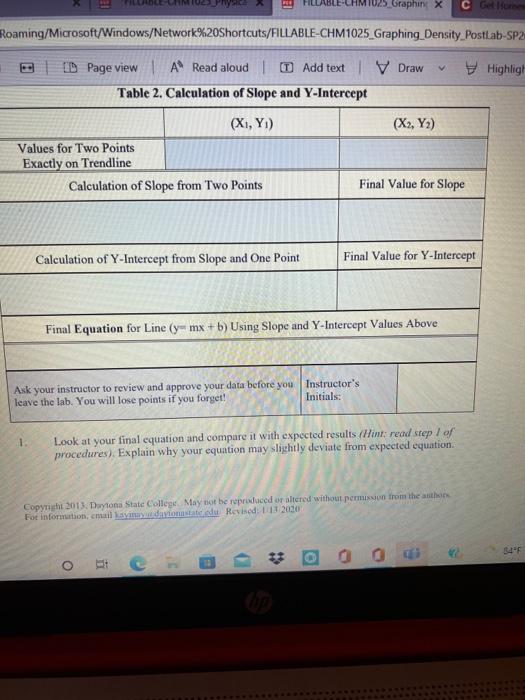
DENSITY AND GRAPHING PRE-LAB - WEEK #1 PROCEDURE: 1. During this first week, you will practice graphing a set of data, which shows the relationship between the Celsius and Fahrenheit temperature scales. From the data, you will be calculating the linear equation, which relates these two familiar values. For this exercise, assume that the temperature in degrees Celsius is the "independent" variable. 2. Review the set of data provided in the table below and record the highest and lowest values for each variable in Table 1 (on page 2). 3. For each variable, subtract the lowest value from the highest value and record the result in Table 1. This tells you the range you want to plot, for each of your variables. 4. In the graph paper provided, count the number of large graph squares on the X-axis. Divide the range for the X variable (subtraction result from step 3) by the number of large graph squares. Record your answer in Table 1. 5. Then, round the result up to a reasonable value (like 1, 2, 5. or 10 etc.) to use per division of your graph. Record your answer in Table 1. Repeat step 4 and 5 for the Y-axis data and record your answers in Table 1. Using the best practices" (see Discussion) for graphing scientific data, prepare a graph of the data shown in the table below using the blank graph paper provided on page 3. Temperature (C) Temperature (F) 6. 7. 126 17.0 221 26.4 318 54.7 62.7 71.6 79.5 89.4 84"F * oc O Sign in X FILLABLE-CHM1025 Physicx FILLABLE CHM1025 Graphinx C Get Homework tan/AppData/Roaming/Microsoft Windows/Network%20Shortcuts/FILLABLE CHM1025_Graphing Density Postlab SP20-P + ID Page view A Read aloud | 0 Add text V Draw Highlight 7. Using the best practices" (see Discussion) for graphing scientific data, prepare a graph of the data shown in the table below using the blank graph paper provided on page 3. Temperature (C) Temperature (F) 12.6 54.7 17.0 62.7 22.1 71.6 26.4 79,5 31.8 89.4 37.7 99.8 43.2 109.8 48.6 119.4 8. Draw a trendline (use a ruler) through your data, using your eyes to "average the best fit. 9. Find two locations on your trendline, which fall exactly on crosshairs of your graph paper lines. Read the values for these two points and record them in Table 2. 10. Using the two points and following the procedure shown in the Discussion section, calculate the slope and y-intercept for your graph. Show the calculation in the space indicated and record your final values in Table 2. Don't forget to include units in your final answers for slope and y-intercept! 11. Don't forget to answer the question at the bottom of last page! Copyright 2013, Daytona State College. May not be reproduced or altered without permission from the anthon For information email kaynayardavonastalodu. Revised: 112/2020 O o 3 54'F Table 1. Calculation of Range Temperature (C) Temperature (F) Lowest Value 12.6 54.7 48.6 119.4 36.0 64.7 Highest Value Range (Highest - Lowest) Range Divided by # Graph Divisions Rounded Value to Use per Division 9.0 9.2 10 10 Table 2. Calculation of Slope and Y-Intercept (X, Y) (X.. Y1) Values for Two Points Exactly on Trendline Calculation of Slope from Two Points Final Value for Slope Calculation of Y-Intercept from Slope and One Point Final Value for Y-Intercept Final Equation for Line (y mx +b) Using Slope and Y-Intercept Values Above - * 84'FA Temperature (C) vs. Temperature (F) 120 . . 110 100 90 emperature (F) 80 70 60 50 10 20 30 40 50 Se> Temporature (C) o ** Graphinx C G Roaming/Microsoft/Windows/Network%20Shortcuts/FILLABLE-CHM1025_Graphing_Density. Posttab-SP2 V Highligt ID Page view A Read aloud ID Add text V Draw Table 2. Calculation of Slope and Y-Intercept (X,Y) (X1,Y) Values for Two Points Exactly on Trendline Calculation of Slope from Two Points Final Value for Slope Calculation of Y-Intercept from Slope and One Point Final Value for Y-Intercept Final Equation for Line (y mx + b) Using Slope and Y-Intercept Values Above Ask your instructor to review and approve your data before you Instructor's leave the lab. You will lose points if you forget! Initials: 1. Look at your final equation and compare it with expected results (Hint: read step / of 1 procedures). Explain why your equation may slightly deviate from expected equation Copyright 2013. Daytona State College. May not be reproduced or altered without permis in from the authon For information, email andavion state Revised: 12020 34" > o Step by Step Solution
There are 3 Steps involved in it
Step: 1

Get Instant Access to Expert-Tailored Solutions
See step-by-step solutions with expert insights and AI powered tools for academic success
Step: 2

Step: 3
Ace Your Homework with AI
Get the answers you need in no time with our AI-driven, step-by-step assistance
Get Started
Chemical Principles
Authors: Steven S. Zumdahl, Donald J. DeCoste
7th edition
9781133109235, 1111580650, 978-1111580650