 Can someone check my work and help me compute C* and find the allocation of weights. i am not sure if i made a mistake somewhere.
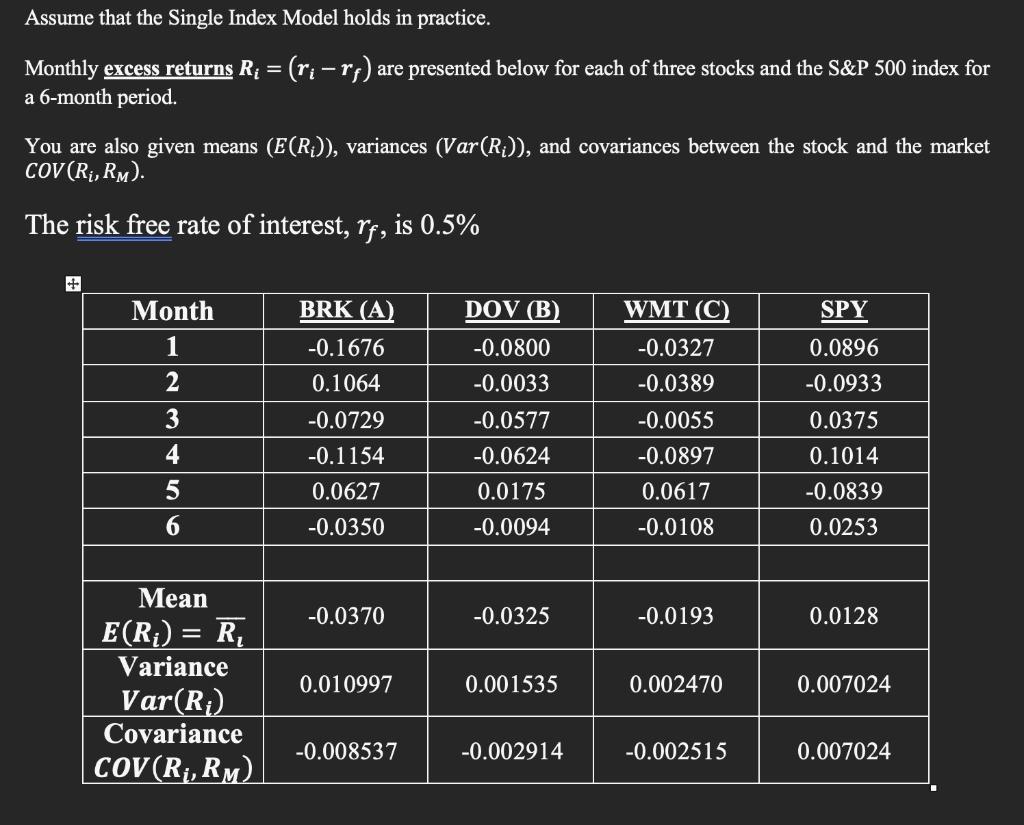
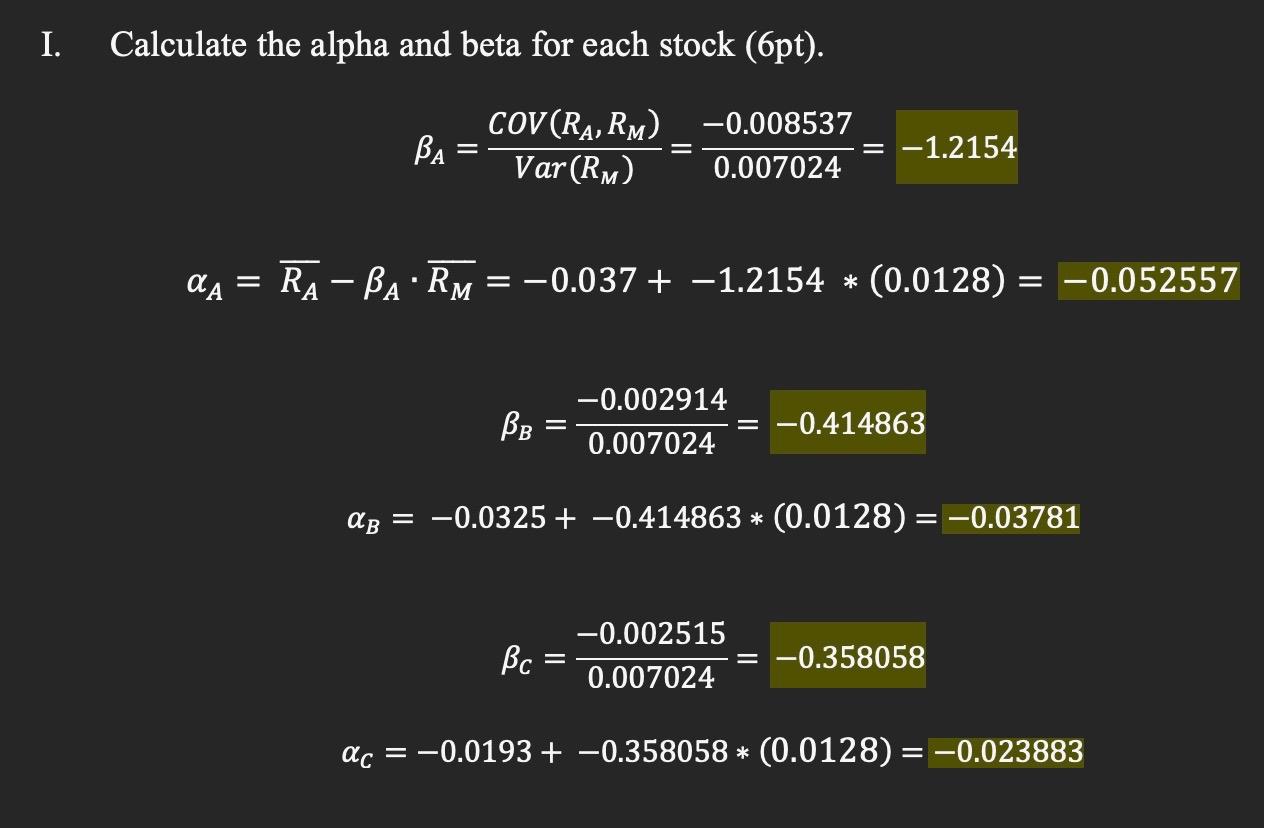
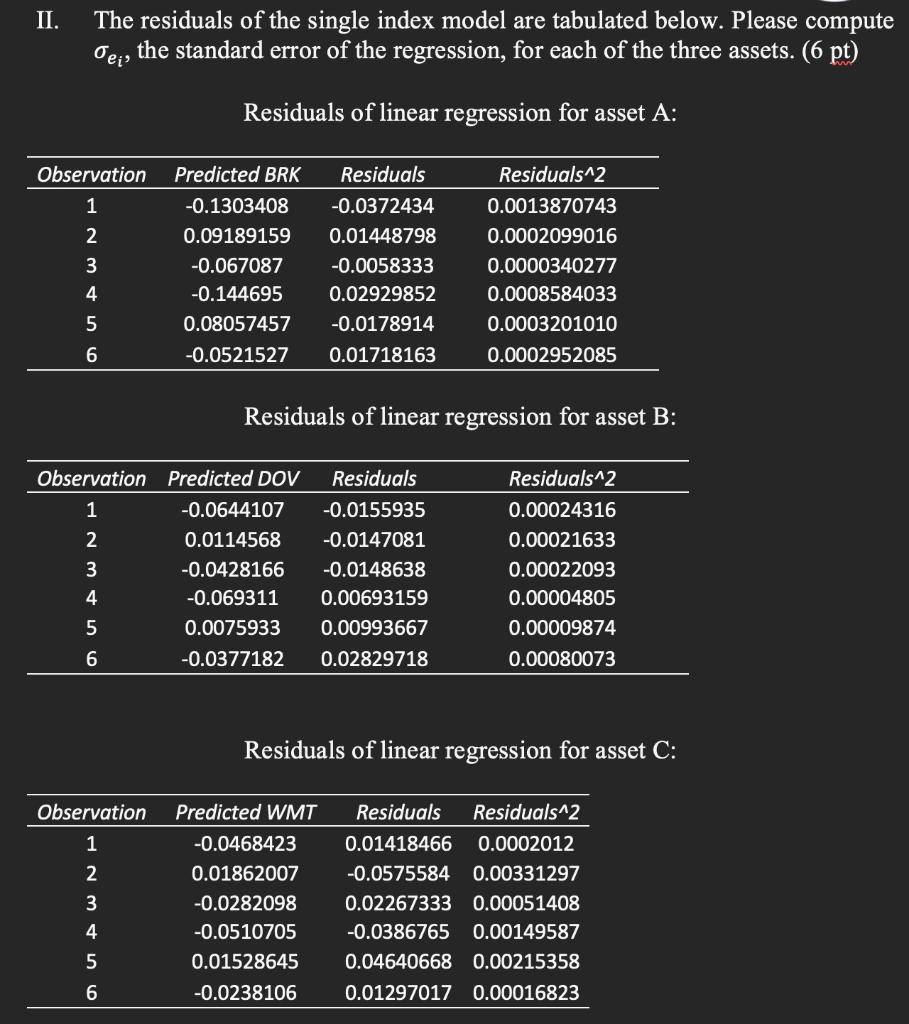
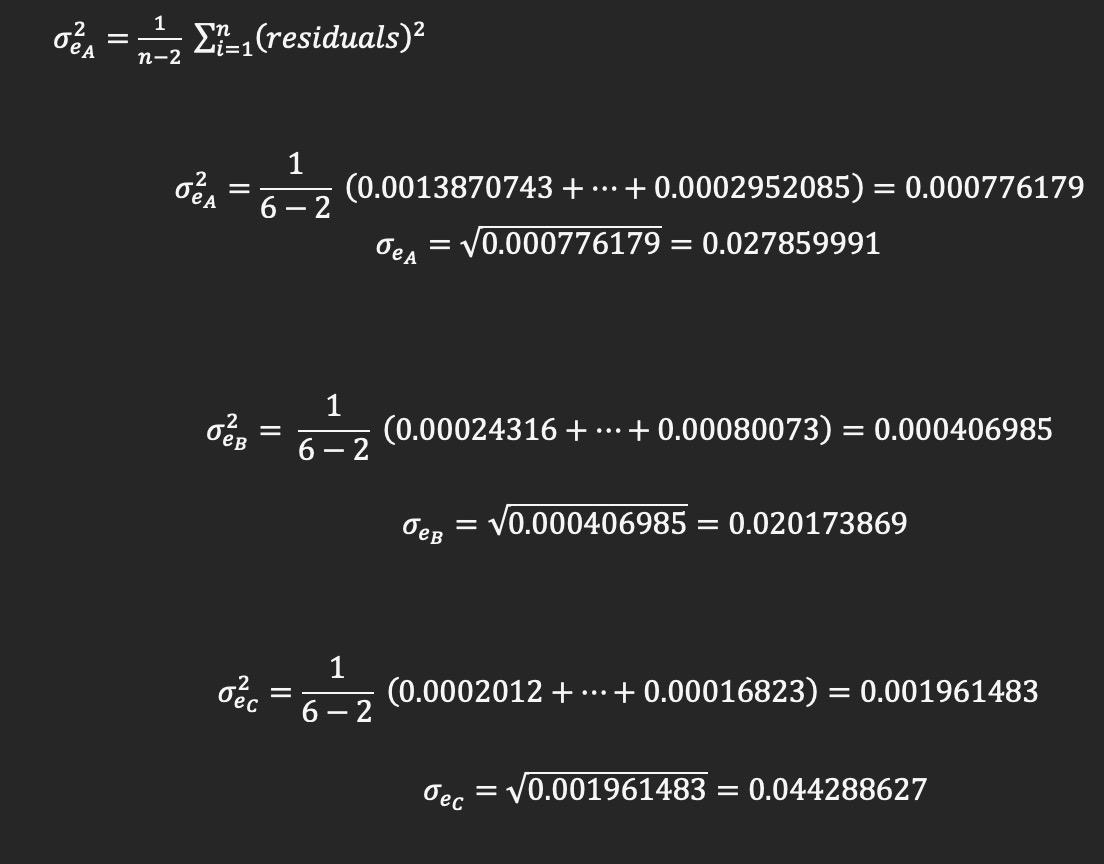
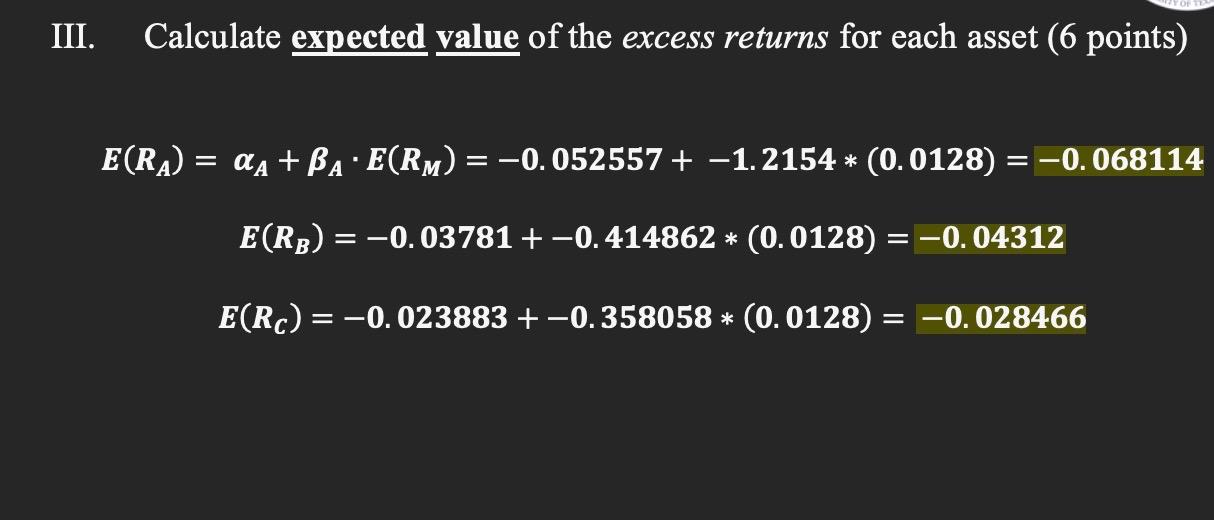
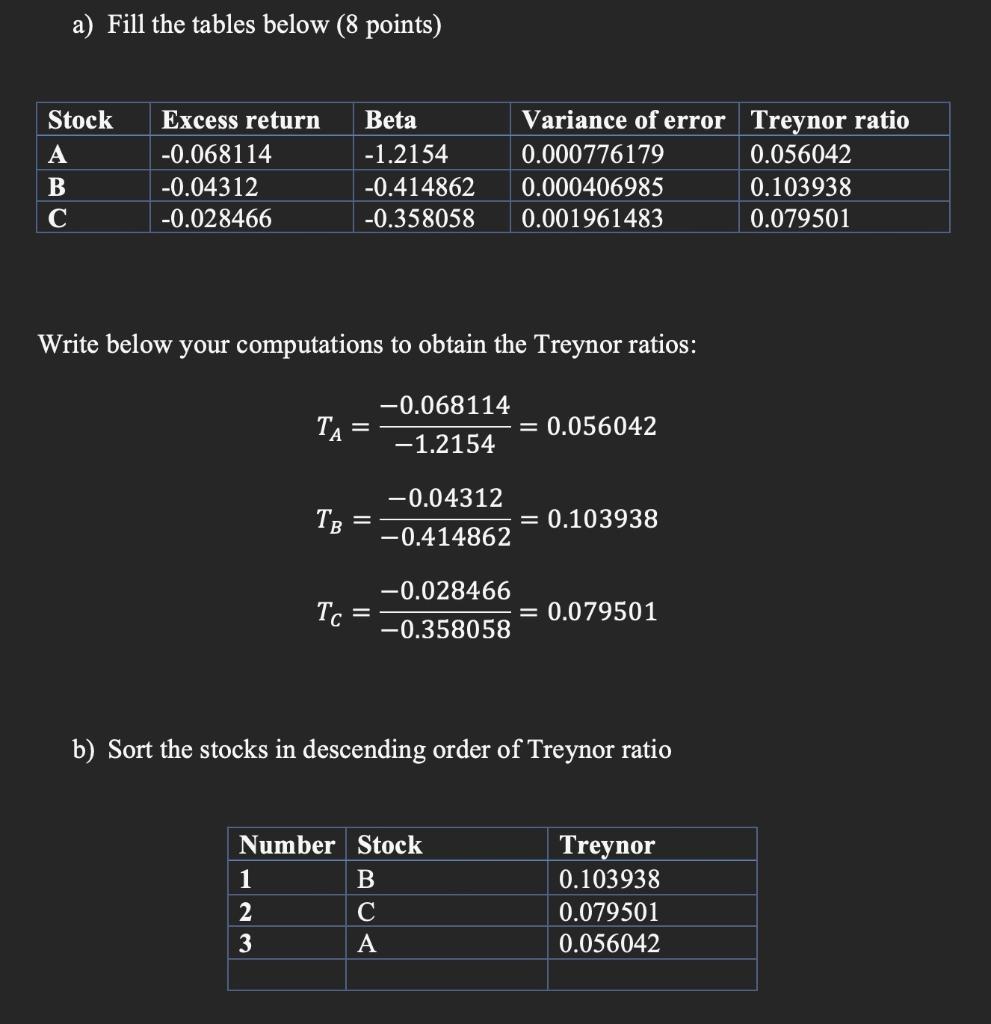
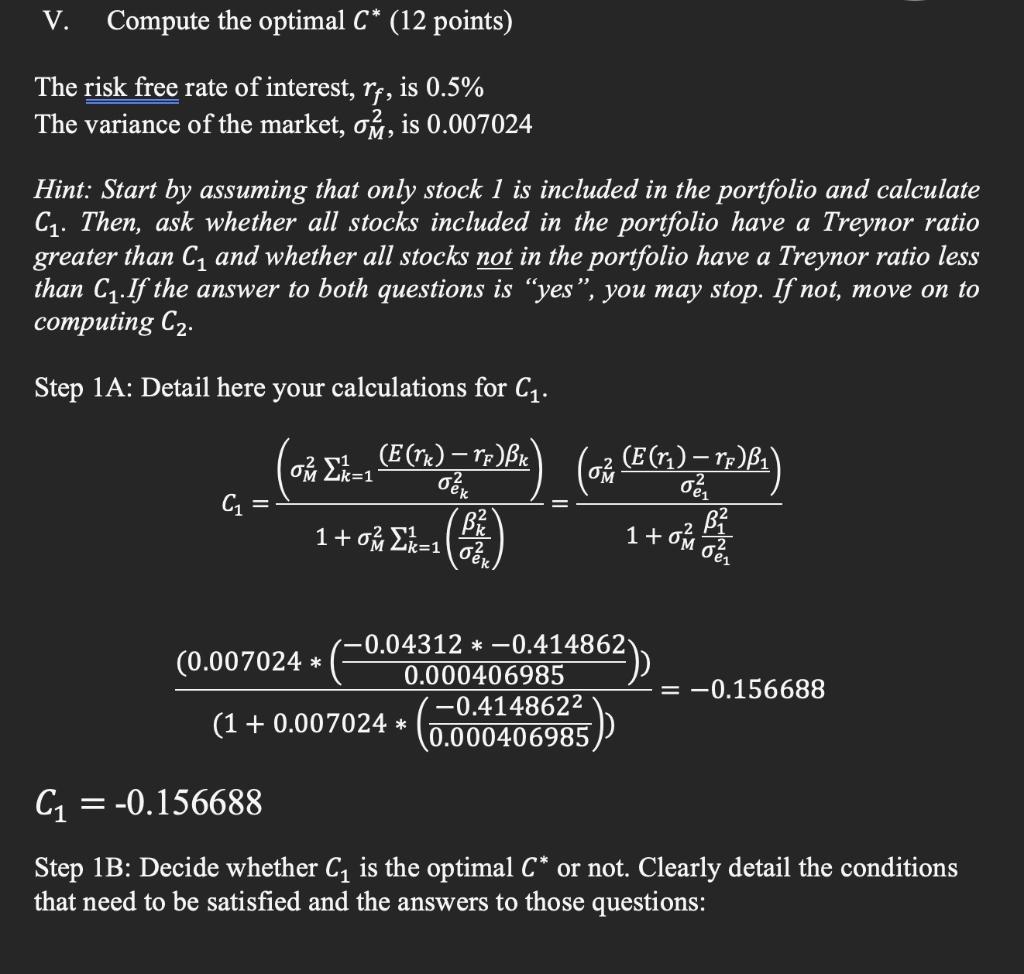
Assume that the Single Index Model holds in practice. Monthly excess returns Ri=(rirf) are presented below for each of three stocks and the S\&P 500 index for a 6-month period. You are also given means (E(Ri)), variances (Var(Ri)), and covariances between the stock and the market Cov(Ri,RM) The risk free rate of interest, rf, is 0.5% I. Calculate the alpha and beta for each stock (6pt). A=Var(RM)COV(RA,RM)=0.0070240.008537=A=RAARM=0.037+1.2154(0.0128)=0.052557B=0.0070240.002914=0.414863B=0.0325+0.414863(0.0128)=0.03781C=0.0070240.002515=0.358058C=0.0193+0.358058(0.0128)=0.023883 II. The residuals of the single index model are tabulated below. Please compute ei, the standard error of the regression, for each of the three assets. (6pt) Residuals of linear regression for asset A: Residuals of linear regression for asset B: Residuals of linear regression for asset C: eA2=n21i=1n(residuals)2 eA2=621(0.0013870743++0.0002952085)=0.000776179 eA=0.000776179=0.027859991 eB2=621(0.00024316++0.00080073)=0.000406985 eB=0.000406985=0.020173869 eC2=621(0.0002012++0.00016823)=0.001961483 eC=0.001961483=0.044288627 III. Calculate expected value of the excess returns for each asset (6 points) E(RA)=A+AE(RM)=0.052557+1.2154(0.0128)=0.068114E(RB)=0.03781+0.414862(0.0128)=0.04312E(RC)=0.023883+0.358058(0.0128)=0.028466 a) Fill the tables below ( 8 points) Write below your computations to obtain the Treynor ratios: TA=1.21540.068114=0.056042TB=0.4148620.04312=0.103938TC=0.3580580.028466=0.079501 b) Sort the stocks in descending order of Treynor ratio V. Compute the optimal C (12 points) The risk free rate of interest, rf, is 0.5% The variance of the market, M2, is 0.007024 Hint: Start by assuming that only stock 1 is included in the portfolio and calculate C1. Then, ask whether all stocks included in the portfolio have a Treynor ratio greater than C1 and whether all stocks not in the portfolio have a Treynor ratio less than C1.If the answer to both questions is "yes", you may stop. If not, move on to computing C2. Step 1A: Detail here your calculations for C1. C1=1+M2k=11(ek2k2)(M2k=11ek2(E(rk)rF)k)=1+M2e1212(M2e12(E(r1)rF)1)(1+0.007024(0.0004069850.4148622))(0.007024(0.0004069850.043120.414862))=0.156688C1=0.156688 Step 1B: Decide whether C1 is the optimal C or not. Clearly detail the conditions that need to be satisfied and the answers to those questions: II. Compute the optimal risky portfolio. This means, compute the necessary Zi 's, the sum of the Zi and the weights of each asset in the optimal portfolio (6 points) Assume that the Single Index Model holds in practice. Monthly excess returns Ri=(rirf) are presented below for each of three stocks and the S\&P 500 index for a 6-month period. You are also given means (E(Ri)), variances (Var(Ri)), and covariances between the stock and the market Cov(Ri,RM) The risk free rate of interest, rf, is 0.5% I. Calculate the alpha and beta for each stock (6pt). A=Var(RM)COV(RA,RM)=0.0070240.008537=A=RAARM=0.037+1.2154(0.0128)=0.052557B=0.0070240.002914=0.414863B=0.0325+0.414863(0.0128)=0.03781C=0.0070240.002515=0.358058C=0.0193+0.358058(0.0128)=0.023883 II. The residuals of the single index model are tabulated below. Please compute ei, the standard error of the regression, for each of the three assets. (6pt) Residuals of linear regression for asset A: Residuals of linear regression for asset B: Residuals of linear regression for asset C: eA2=n21i=1n(residuals)2 eA2=621(0.0013870743++0.0002952085)=0.000776179 eA=0.000776179=0.027859991 eB2=621(0.00024316++0.00080073)=0.000406985 eB=0.000406985=0.020173869 eC2=621(0.0002012++0.00016823)=0.001961483 eC=0.001961483=0.044288627 III. Calculate expected value of the excess returns for each asset (6 points) E(RA)=A+AE(RM)=0.052557+1.2154(0.0128)=0.068114E(RB)=0.03781+0.414862(0.0128)=0.04312E(RC)=0.023883+0.358058(0.0128)=0.028466 a) Fill the tables below ( 8 points) Write below your computations to obtain the Treynor ratios: TA=1.21540.068114=0.056042TB=0.4148620.04312=0.103938TC=0.3580580.028466=0.079501 b) Sort the stocks in descending order of Treynor ratio V. Compute the optimal C (12 points) The risk free rate of interest, rf, is 0.5% The variance of the market, M2, is 0.007024 Hint: Start by assuming that only stock 1 is included in the portfolio and calculate C1. Then, ask whether all stocks included in the portfolio have a Treynor ratio greater than C1 and whether all stocks not in the portfolio have a Treynor ratio less than C1.If the answer to both questions is "yes", you may stop. If not, move on to computing C2. Step 1A: Detail here your calculations for C1. C1=1+M2k=11(ek2k2)(M2k=11ek2(E(rk)rF)k)=1+M2e1212(M2e12(E(r1)rF)1)(1+0.007024(0.0004069850.4148622))(0.007024(0.0004069850.043120.414862))=0.156688C1=0.156688 Step 1B: Decide whether C1 is the optimal C or not. Clearly detail the conditions that need to be satisfied and the answers to those questions: II. Compute the optimal risky portfolio. This means, compute the necessary Zi 's, the sum of the Zi and the weights of each asset in the optimal portfolio (6 points)