can someone explain this problem and how you plug in the things ti formula to get the answer
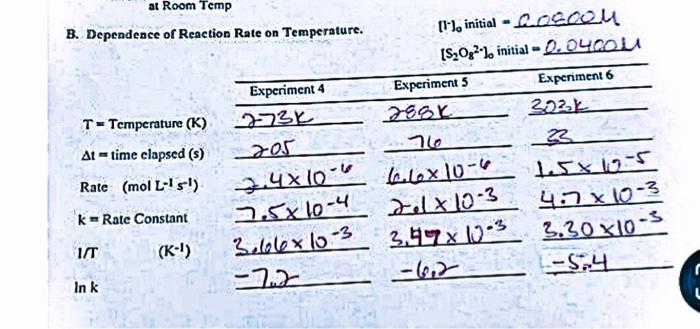
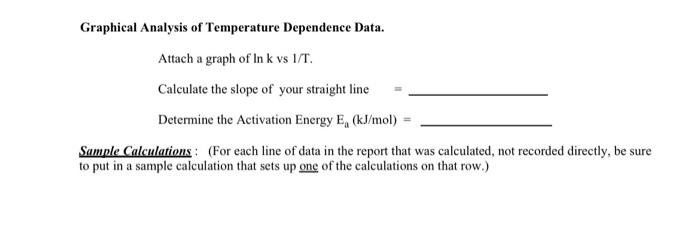
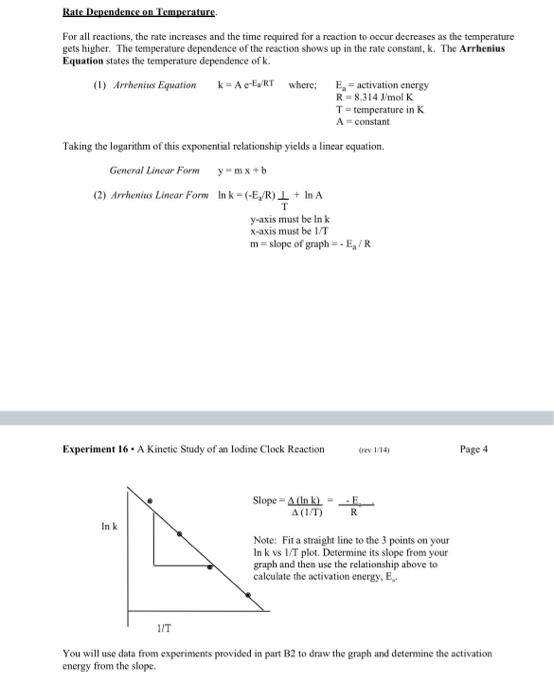
B. Dependence of Reaction Rate on Temperature. Graphical Analysis of Temperature Dependence Data. Attach a graph of lnkvvs1/T. Calculate the slope of your straight line = Determine the Activation Energy Ea(kJ/mol)= Sample Calculations : (For each line of data in the report that was calculated, not recorded directly, be sure to put in a sample calculation that sets up one of the calculations on that row.) Rate Dependence on Temperature. For all reactions, the rate increases and the time required for a reaction to occur decreases as the temperature gets higher. The temperature dependence of the reaction shows up in the rate constant, k. The Arrhenius Equation states the temperature dependence of k. (1) Arrhenius Equation k=Ae-E2RTwhere;R=8.314lmolKT=temperatureinKA=constantEa=activationenergy Taking the logarithm of this exponential relationship yiclds a lincar equation. General Lincar Form y=mx+b (2) Arhenius Lincar Form lnk=(E3/R)TL+lnA y-axis must be In k x-axis must be 1/T m=slopeofgraph=Ea/R Experiment 16 - A Kinetic Study of an Iodine Clock Reaction (rev 144) Page 4 e=(1/T)(lnk)=RE :) Fit a straight line to the 3 points on your vs 1/T plot. Determine its slope from your h and then use the relationship above to alate the activation energy, E,. You will use data from experiments provided in past B2 to draw the graph and determine the activation energy from the slope. B. Dependence of Reaction Rate on Temperature. Graphical Analysis of Temperature Dependence Data. Attach a graph of lnkvvs1/T. Calculate the slope of your straight line = Determine the Activation Energy Ea(kJ/mol)= Sample Calculations : (For each line of data in the report that was calculated, not recorded directly, be sure to put in a sample calculation that sets up one of the calculations on that row.) Rate Dependence on Temperature. For all reactions, the rate increases and the time required for a reaction to occur decreases as the temperature gets higher. The temperature dependence of the reaction shows up in the rate constant, k. The Arrhenius Equation states the temperature dependence of k. (1) Arrhenius Equation k=Ae-E2RTwhere;R=8.314lmolKT=temperatureinKA=constantEa=activationenergy Taking the logarithm of this exponential relationship yiclds a lincar equation. General Lincar Form y=mx+b (2) Arhenius Lincar Form lnk=(E3/R)TL+lnA y-axis must be In k x-axis must be 1/T m=slopeofgraph=Ea/R Experiment 16 - A Kinetic Study of an Iodine Clock Reaction (rev 144) Page 4 e=(1/T)(lnk)=RE :) Fit a straight line to the 3 points on your vs 1/T plot. Determine its slope from your h and then use the relationship above to alate the activation energy, E,. You will use data from experiments provided in past B2 to draw the graph and determine the activation energy from the slope