Answered step by step
Verified Expert Solution
Question
1 Approved Answer
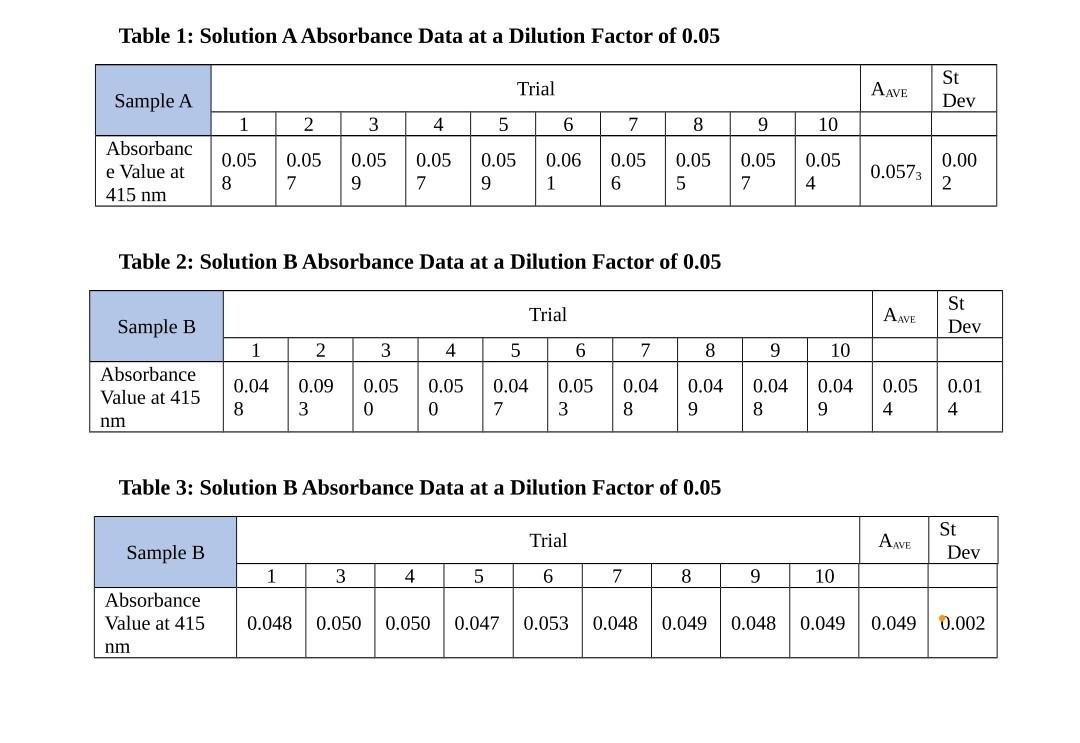
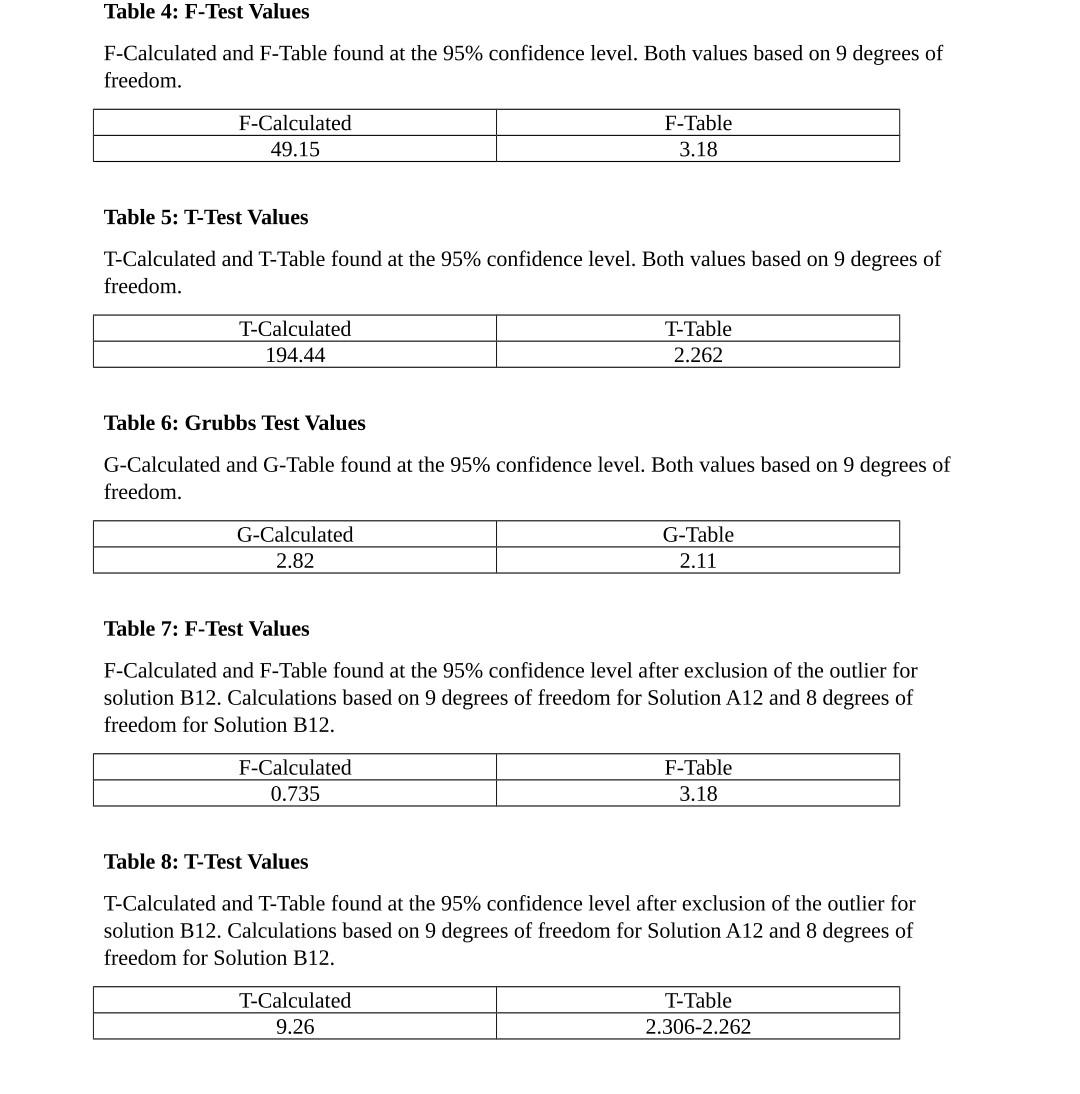
Can someone explain to me how the F, T and G test values were obtained using the table? Show workings/formulas please Table 1: Solution A


Can someone explain to me how the F, T and G test values were obtained using the table? Show workings/formulas please
Table 1: Solution A Absorbance Data at a Dilution Factor of 0.05 Trial AAVE St Dev Sample A 1 2 3 4 5 6 7 8 9 10 Absorbanc e Value at 415 nm 0.05 8 0.05 7 0.05 9 0.05 7 0.05 9 0.06 1 hoopis 0.05 6 0.05 5 0.05 7 0.05 4 0.0573 0.00 2 Table 2: Solution B Absorbance Data at a Dilution Factor of 0.05 Trial AAVE St Dev Sample B 1 2 3 4 5 6 7 8 9 10 Absorbance Value at 415 nm 0.04 8 0.09 3 0.05 0 0.05 0 0.04 7 0.05 3 0.04 8 0.04 9 0.04 8 0.04 9 0.05 4 0.01 4 Table 3: Solution B Absorbance Data at a Dilution Factor of 0.05 Trial AAVE St Dev Sample B 1 3 4 5 6 7 8 9 10 Absorbance Value at 415 nm 0.048 0.050 0.050 0.047 0.053 0.048 0.049 0.048 0.049 0.049 0.002 Table 4: F-Test Values F-Calculated and F-Table found at the 95% confidence level. Both values based on 9 degrees of freedom. F-Calculated 49.15 F-Table 3.18 Table 5: T-Test Values T-Calculated and T-Table found at the 95% confidence level. Both values based on 9 degrees of freedom. T-Calculated 194.44 T-Table 2.262 Table 6: Grubbs Test Values G-Calculated and G-Table found at the 95% confidence level. Both values based on 9 degrees of freedom. G-Calculated 2.82 G-Table 2.11 Table 7: F-Test Values F-Calculated and F-Table found at the 95% confidence level after exclusion of the outlier for solution B12. Calculations based on 9 degrees of freedom for Solution A12 and 8 degrees of freedom for Solution B12. F-Calculated 0.735 F-Table 3.18 Table 8: T-Test Values T-Calculated and T-Table found at the 95% confidence level after exclusion of the outlier for solution B12. Calculations based on 9 degrees of freedom for Solution A12 and 8 degrees of freedom for Solution B12. T-Calculated 9.26 T-Table 2.306-2.262 Table 1: Solution A Absorbance Data at a Dilution Factor of 0.05 Trial AAVE St Dev Sample A 1 2 3 4 5 6 7 8 9 10 Absorbanc e Value at 415 nm 0.05 8 0.05 7 0.05 9 0.05 7 0.05 9 0.06 1 hoopis 0.05 6 0.05 5 0.05 7 0.05 4 0.0573 0.00 2 Table 2: Solution B Absorbance Data at a Dilution Factor of 0.05 Trial AAVE St Dev Sample B 1 2 3 4 5 6 7 8 9 10 Absorbance Value at 415 nm 0.04 8 0.09 3 0.05 0 0.05 0 0.04 7 0.05 3 0.04 8 0.04 9 0.04 8 0.04 9 0.05 4 0.01 4 Table 3: Solution B Absorbance Data at a Dilution Factor of 0.05 Trial AAVE St Dev Sample B 1 3 4 5 6 7 8 9 10 Absorbance Value at 415 nm 0.048 0.050 0.050 0.047 0.053 0.048 0.049 0.048 0.049 0.049 0.002 Table 4: F-Test Values F-Calculated and F-Table found at the 95% confidence level. Both values based on 9 degrees of freedom. F-Calculated 49.15 F-Table 3.18 Table 5: T-Test Values T-Calculated and T-Table found at the 95% confidence level. Both values based on 9 degrees of freedom. T-Calculated 194.44 T-Table 2.262 Table 6: Grubbs Test Values G-Calculated and G-Table found at the 95% confidence level. Both values based on 9 degrees of freedom. G-Calculated 2.82 G-Table 2.11 Table 7: F-Test Values F-Calculated and F-Table found at the 95% confidence level after exclusion of the outlier for solution B12. Calculations based on 9 degrees of freedom for Solution A12 and 8 degrees of freedom for Solution B12. F-Calculated 0.735 F-Table 3.18 Table 8: T-Test Values T-Calculated and T-Table found at the 95% confidence level after exclusion of the outlier for solution B12. Calculations based on 9 degrees of freedom for Solution A12 and 8 degrees of freedom for Solution B12. T-Calculated 9.26 T-Table 2.306-2.262Step by Step Solution
There are 3 Steps involved in it
Step: 1

Get Instant Access to Expert-Tailored Solutions
See step-by-step solutions with expert insights and AI powered tools for academic success
Step: 2

Step: 3

Ace Your Homework with AI
Get the answers you need in no time with our AI-driven, step-by-step assistance
Get Started


