Answered step by step
Verified Expert Solution
Link Copied!

Question

1 Approved Answer

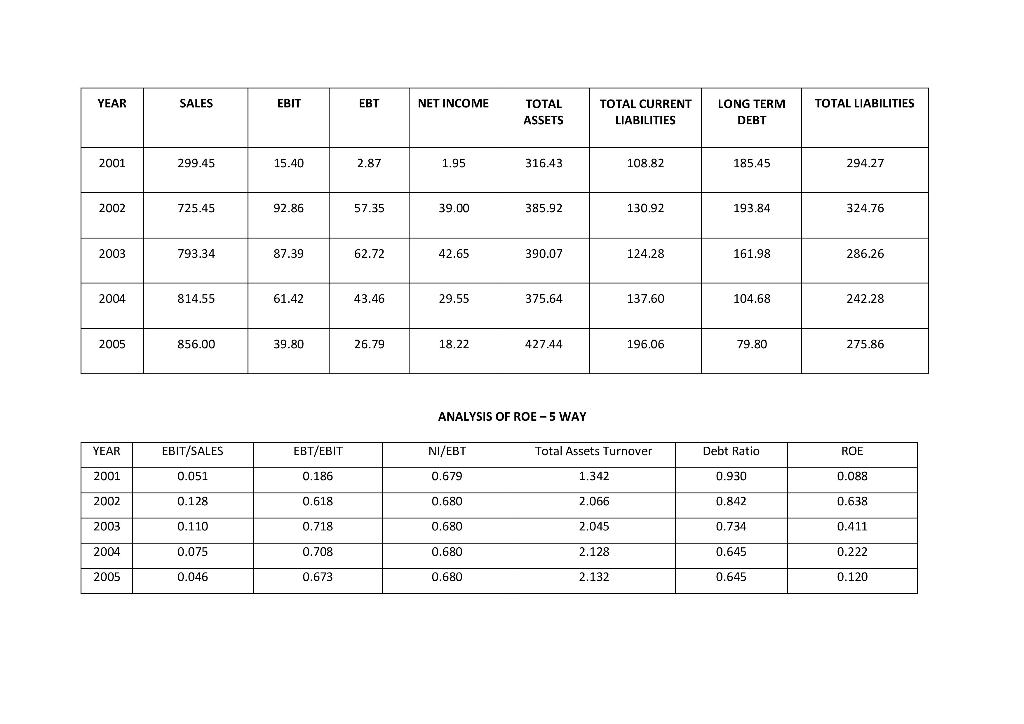
can someone help me interpret this analysis of ROE - 5 Way YEAR SALES EBIT EBT NET INCOME TOTAL LIABILITIES TOTAL ASSETS TOTAL CURRENT LIABILITIES

can someone help me interpret this analysis of ROE - 5 Way

image text in transcribed

YEAR SALES EBIT EBT NET INCOME TOTAL LIABILITIES TOTAL ASSETS TOTAL CURRENT LIABILITIES LONG TERM DEBT 2001 299.45 15.40 2.87 1.95 316.43 108.82 185.45 294.27 2002 725.45 92.86 57.35 39.00 385.92 130.92 193.84 324.76 2003 793.34 87.39 62.72 42.65 390.07 124.28 161.98 286.26 2004 814.55 61.42 43.46 29.55 375.64 137.60 104.68 242.28 2005 856.00 39.80 26.79 18.22 427.44 196.06 79.80 275.86 ANALYSIS OF ROE-5 WAY YEAR EBIT/SALES EBT/EBIT NI/EBT Total Assets Turnover Debt Ratio ROE 2001 0.051 0.186 0.679 1.342 0.930 0.088 2002 0.128 0.618 0.680 2.066 0.842 0.638 2003 0.110 0.718 0.680 2.045 0.734 0.411 2004 0.075 0.708 0.680 2.128 0.645 0.222 2005 0.046 0.673 0.680 2.132 0.645 0.120

Step by Step Solution

There are 3 Steps involved in it

Step: 1

blur-text-image

Get Instant Access to Expert-Tailored Solutions

See step-by-step solutions with expert insights and AI powered tools for academic success

Step: 2

blur-text-image

Step: 3

blur-text-image

Ace Your Homework with AI

Get the answers you need in no time with our AI-driven, step-by-step assistance

Get Started

Recommended Textbook for

Entrepreneurial Financial Management An Applied Approach

Authors: Jeffrey R Cornwall, David O Vang, Jean M Hartman

5th Edition

0367335417, 978-0367335410

More Books

Students also viewed these Finance questions