Can someone help me number 1 pls, I really need it.

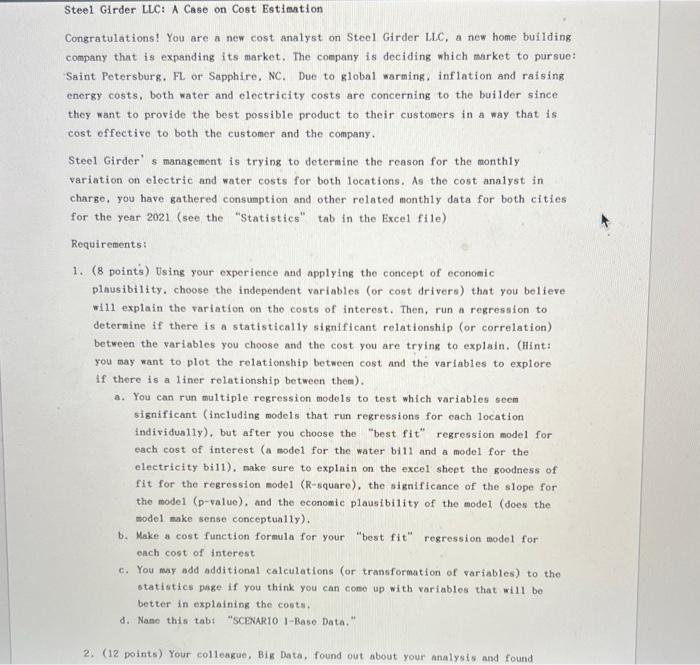
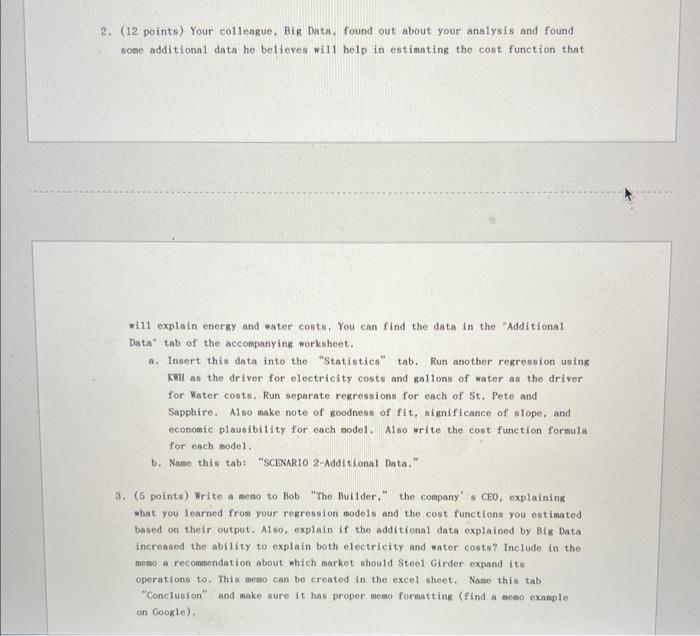
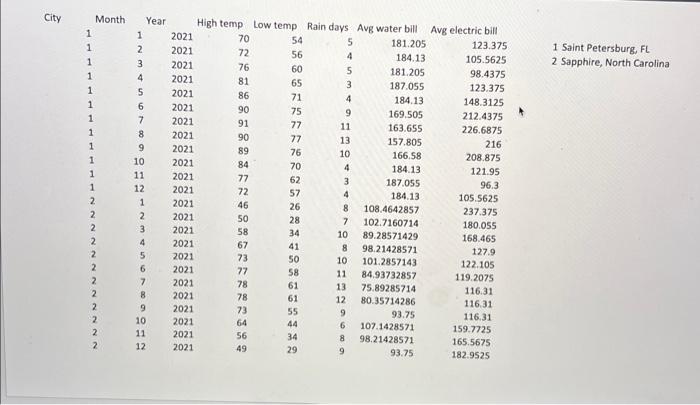
2. (12 points) Your colleague, Big Data, found out about your analysis and found sone additional data he believes will help in estimating the cost function that will explain energy and water costs. You can find the data in the "Additional Data" tab of the acconpanying worksheet. a. Insert this data into the "Statistics" tab. Run another regression using K\$H as the driver for electricity costs and gallons of water as the driver for Water costs. Run separate regressions for each of St. Pote and Sapphire. Also make note of goodness of fit, significance of slope, and economic plausibility for each aodel. Also write the cost function formula for each mode1. b. Name this tab: "SCENaRI0 2-Additional Data." 3. (5 points) rite a meno to Bob "The Builder," the company" " CEO, explaining what you learned from your regression models and the cost functions you estimated based on their output, A1so, explain if the additional data explained by Big Data increased the ability to explain both electricity and water costs? Include in the themo a recommendation about which markot should Steel Girder expand its operations to. This meno can be created in the excel sheet. Nano this tab "Conclusion" and aake sure it has proper memo formatting (find a meeo exanple on Goog16). 1 Saint Petersburg, FL 2 Sapphire, North Carolina Steel Girder LLC: A Case on Cost Estimation Congratulations! You are a new cost analyst on Steel Girder LLC, a new home building company that is expanding its market. The company is deciding which market to pursue: Saint Petersburg. FL or Sapphire, NC. Due to global warming, inflation and raising energy costs, both water and electricity costs are concerning to the builder since they want to provide the best possible product to their customers in a way that is cost effective to both the customer and the company. Steel Girder' s management is trying to determine the reason for the monthly variation on electric and water costs for both locations. As the cost analyst in charge, you have gathered consumption and other related monthly data for both cities for the year 2021 (see the "Statistics" tab in the Excel file) Requirements: 1. ( 8 points) Using your experience and applying the concept of economic plausibility. choose the independent variables (or cost drivers) that you belfeve will explain the variation on the costs of interest. Then, run a regression to determine if there is a statistically significant relationship (or correlation) between the variables you choose and the cost you are trying to explain. (Hint: you may want to plot the relationship between cost and the variables to explore if there is a liner relationship between them). a. You can run wultiple regression models to test which variables seem significant (including models that run regressions for each location individua11y), but after you choose the "best fit regression model for each cost of interest ( a model for the water bill and a model for the electricity bi11), make sure to explain on the excel sheet the goodness of fit for the regression model ( R-square), the significance of the slope for the model (p-value), and the economic plausibility of the model (does the model make sense conceptually). b. Nake a cost function formula for your "best fit" regression model for each cost of interest c. You may add additional calculations (or transformation of variables) to the statistics page if you think you can cono up with variables that will be better in explaining the costs. d. Nase this tabt "SCEvarto 1-Base Data." 2. (12 points) Your colleague, Big Data, found out about your analysis and found sone additional data he believes will help in estimating the cost function that will explain energy and water costs. You can find the data in the "Additional Data" tab of the acconpanying worksheet. a. Insert this data into the "Statistics" tab. Run another regression using K\$H as the driver for electricity costs and gallons of water as the driver for Water costs. Run separate regressions for each of St. Pote and Sapphire. Also make note of goodness of fit, significance of slope, and economic plausibility for each aodel. Also write the cost function formula for each mode1. b. Name this tab: "SCENaRI0 2-Additional Data." 3. (5 points) rite a meno to Bob "The Builder," the company" " CEO, explaining what you learned from your regression models and the cost functions you estimated based on their output, A1so, explain if the additional data explained by Big Data increased the ability to explain both electricity and water costs? Include in the themo a recommendation about which markot should Steel Girder expand its operations to. This meno can be created in the excel sheet. Nano this tab "Conclusion" and aake sure it has proper memo formatting (find a meeo exanple on Goog16). 1 Saint Petersburg, FL 2 Sapphire, North Carolina Steel Girder LLC: A Case on Cost Estimation Congratulations! You are a new cost analyst on Steel Girder LLC, a new home building company that is expanding its market. The company is deciding which market to pursue: Saint Petersburg. FL or Sapphire, NC. Due to global warming, inflation and raising energy costs, both water and electricity costs are concerning to the builder since they want to provide the best possible product to their customers in a way that is cost effective to both the customer and the company. Steel Girder' s management is trying to determine the reason for the monthly variation on electric and water costs for both locations. As the cost analyst in charge, you have gathered consumption and other related monthly data for both cities for the year 2021 (see the "Statistics" tab in the Excel file) Requirements: 1. ( 8 points) Using your experience and applying the concept of economic plausibility. choose the independent variables (or cost drivers) that you belfeve will explain the variation on the costs of interest. Then, run a regression to determine if there is a statistically significant relationship (or correlation) between the variables you choose and the cost you are trying to explain. (Hint: you may want to plot the relationship between cost and the variables to explore if there is a liner relationship between them). a. You can run wultiple regression models to test which variables seem significant (including models that run regressions for each location individua11y), but after you choose the "best fit regression model for each cost of interest ( a model for the water bill and a model for the electricity bi11), make sure to explain on the excel sheet the goodness of fit for the regression model ( R-square), the significance of the slope for the model (p-value), and the economic plausibility of the model (does the model make sense conceptually). b. Nake a cost function formula for your "best fit" regression model for each cost of interest c. You may add additional calculations (or transformation of variables) to the statistics page if you think you can cono up with variables that will be better in explaining the costs. d. Nase this tabt "SCEvarto 1-Base Data


