

Can someone help me please how can I get this plot I have 3 hours only to submit this task. Use age, fnlwgt, education-num and
Can someone help me please how can I get this plot I have 3 hours only to submit this task.
Use age, fnlwgt, education-num and hours-per-week to train a model with K-Means. Apply the following settings: (a) Some values in Age columns are represented as decade, e.g., 20s or 30s. You are required to clean these values by removing the s and convert it into an integer value. (b) Cluster the data into two clusters. Reduce the number of features to two features. Use the first new feature as X coordinate and the second new feature as Y coordinate and visualize them twice using appropriate visualisation technique as follows: (a) The color of each individual in the first visualization is decided based on the value in Income attribute. (b) The color of each individual in the second visualization is decided based on the label that is generated by the clustering algorithm. (c) Visualize the two plots next to each other.
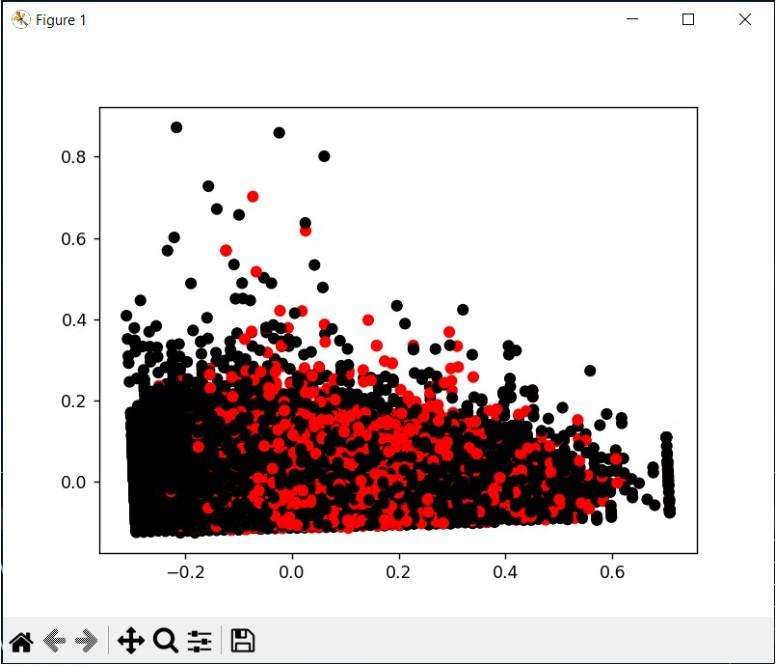
this is the code that im using but not showing up
def Task3(): df = pd.read_csv('humanDetails.csv', encoding='utf-8') df['age'] = df['age'].str.replace('s', '').astype(int) # reduce the number of features to two X = df[['age', 'fnlwgt', 'education-num', 'hours-per-week']] # train the model with K-Means kmeans = KMeans(n_clusters=2).fit(X) # create two new features X_new = kmeans.transform(X) # visualize the data with two plots fig, ax = plt.subplots(1, 2, figsize=(12, 6)) #color for first plot of each individual is decided based on the value in Income attribute ax[0].scatter(X_new[:, 0], X_new[:, 1], c=df['Income']) ax[0].set_title('Income') ax[0].set_xlabel('X coordinate') ax[0].set_ylabel('Y coordinate') # second plot - color of each individual is decided based on the label generated by the clustering algorithm ax[1].scatter(X_new[:, 0], X_new[:, 1], c=kmeans.labels_) ax[1].set_title('K-Means Clustering') ax[1].set_xlabel('X coordinate') ax[1].set_ylabel('Y coordinate') plt.show() Task3() Figure 1 Qb Step by Step Solution
There are 3 Steps involved in it
Step: 1

See step-by-step solutions with expert insights and AI powered tools for academic success
Step: 2

Step: 3
Ace Your Homework with AI
Get the answers you need in no time with our AI-driven, step-by-step assistance
Get Started
Authors: Michael L. Brodie
1st Edition
1947487167, 978-1947487161