

Answered step by step
Verified Expert Solution
Question
1 Approved Answer
Can someone help me solve this?! Graph 1 Graph 2 lota unts proouced Total units produced Graph 3 Graph 4 j Figure 5-1 Which of
Can someone help me solve this?! 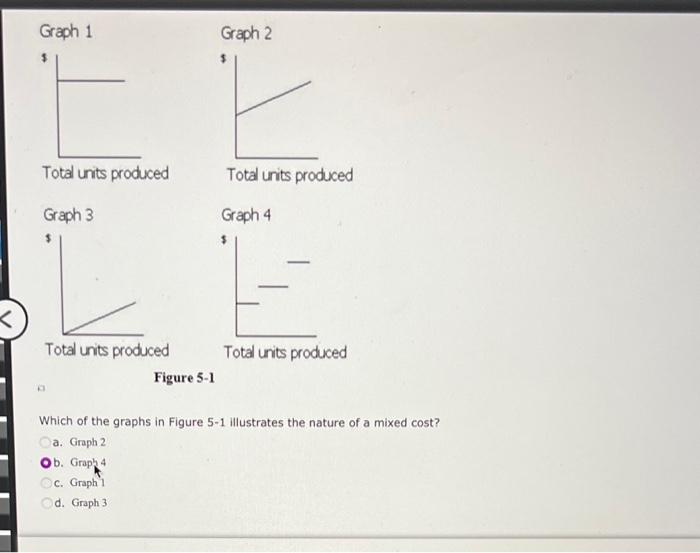
Step by Step Solution
There are 3 Steps involved in it
Step: 1

Get Instant Access to Expert-Tailored Solutions
See step-by-step solutions with expert insights and AI powered tools for academic success
Step: 2

Step: 3
Ace Your Homework with AI
Get the answers you need in no time with our AI-driven, step-by-step assistance
Get Started
Payroll Management 2020 Edition
Authors: Steven M. Bragg
1642210366, 978-1642210361