can someone help me solve this? the data and informatiin is there for JP Morgan Chase with all the instructions.
I sent the images in parts. it should be more clear now. unless you want me to email you seperately. im
not surr thata allowed but if so just drop your email.
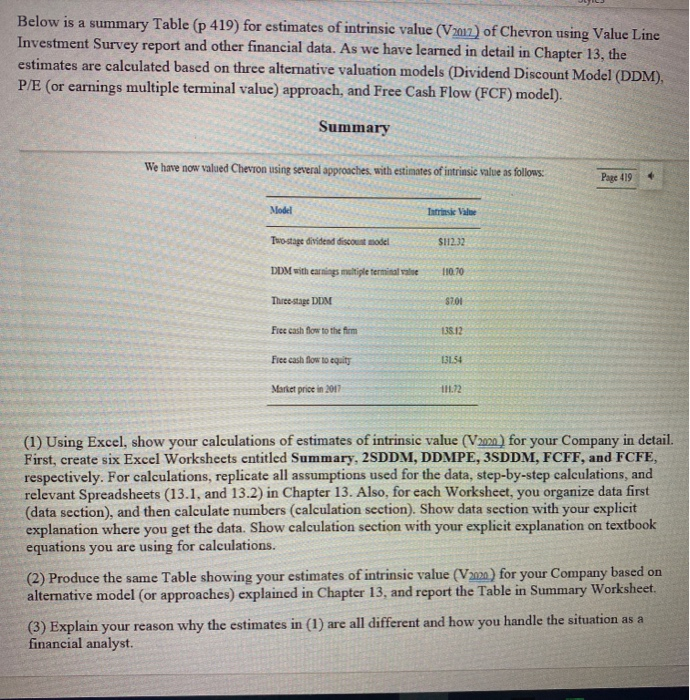
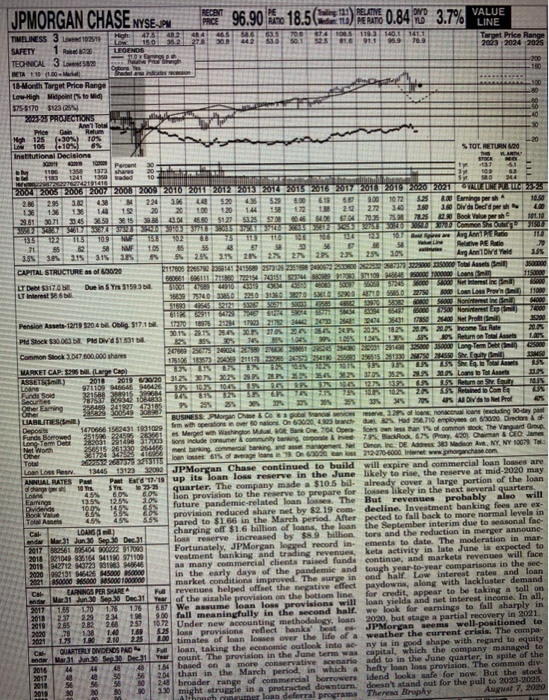
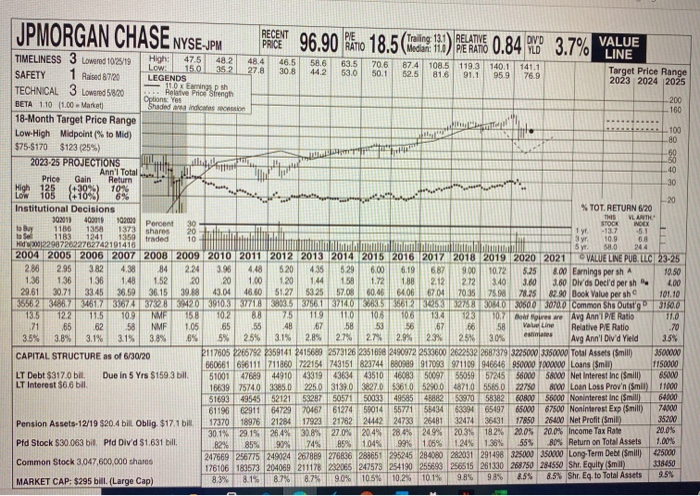
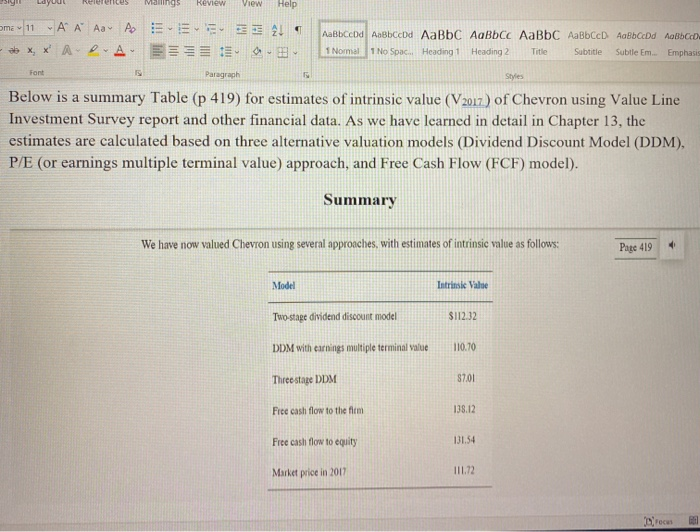
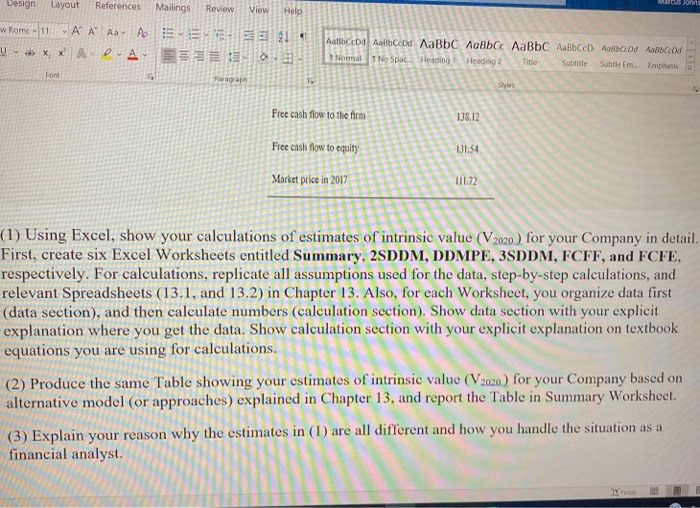
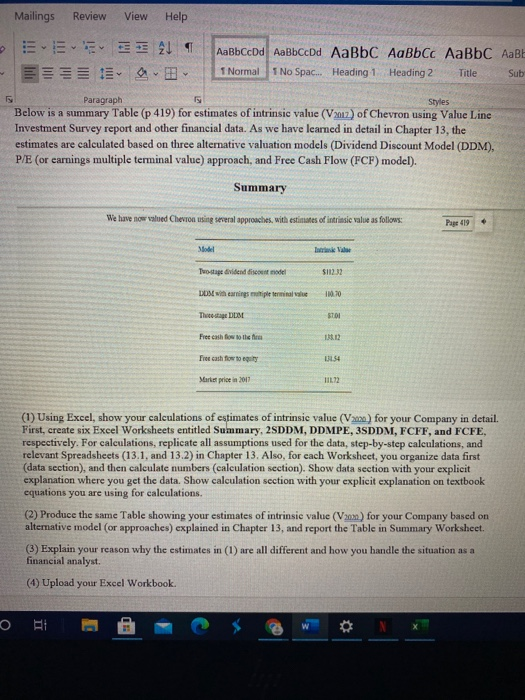
Mailings Review View Help E 21 EIE d bccDd 1 Normal 1 No Spac.. Heading 1 Heading 2 Title Sub Y Paragraph Styles Below is a summary Table (p 419) for estimates of intrinsic value (2012) of Chevron using Value Line Investment Survey report and other financial data. As we have learned in detail in Chapter 13, the estimates are calculated based on three alternative valuation models (Dividend Discount Model (DDM), P/E (or earnings multiple terminal value) approach, and Free Cash Flow (FCF) model). Summary We have now valued Chevron using several approaches, with estimates of intrinsic value as follows: Page 419 Model Two-stage dividend discottidel $112.32 DDM with earnings tipe terminale 100.70 Thaceae DDM STOI Free enth fow to the fim 13.12 Free cash flow to 3154 Market price in 2017 11.12 (1) Using Excel, show your calculations of estimates of intrinsic value (V220) for your Company in detail. First, create six Excel Worksheets entitled Summary, 2SDDM, DDMPE, 3SDDM, FCFF, and FCFE, respectively. For calculations, replicate all assumptions used for the data, step-by-step calculations, and relevant Spreadsheets (13.1, and 13.2) in Chapter 13. Also, for each Worksheet, you organize data first (data section), and then calculate numbers (calculation section). Show data section with your explicit explanation where you get the data. Show calculation section with your explicit explanation on textbook equations you are using for calculations. (2) Produce the same Table showing your estimates of intrinsic value (Vox) for your Company based on alterative model (or approaches) explained in Chapter 13, and report the Table in Summary Worksheet. (3) Explain your reason why the estimates in (1) are all different and how you handle the situation as a financial analyst. (4) Upload your Excel Workbook. Bi E JPMORGAN CHASE NYSE_SH PRO 96.90 Kino 18.50 3.7% 89 889 Price 01 E PE DVD VALUE TU) PERATO LINE TIMELINESS 3 Lovered 102519 High 47542 44 100.1111 15.0352 300 442 950 789 Target Price Range SAFETY LEGENDS 2003 2024 2025 10 E TECHNICAL 3 L5% ngh -200 BETA (100 18-Month Target Price Range Low High Midpoint to id) 575-51703123254 2003-25 PROJECTIONS AT Heur High 125 (-30%) 10% Low 106 1.10% -20 Institutional Decisions TOT. RETURN $20 HAR 2011 ICE w 135 AM 133 shares 1241 1350 3 199 2004 2005 2006 2007 2008 2009 2010 2011 2012 2013 2014 2015 2016 2017 2016 2010 2020 2021TLLEUNERIA UE323 2. 36 42 224 3.86 2 520 435 61 900 1072 5.5 8.0 Enige persh 10.50 13 144 20 20 100 120 1.44 150 172 120 272 340 3.50 100 DI de Deafdpers 40 2.1 3071 24 46.50 5127 5024 5959 80464 7035752 7.25 22.0 Book Value per she 101.10 DEUTEROWHOSEMALIZKUSTEETSETESEADMED Common Shoes 250 TE TEL 109 NU 13:50 45 TU 07 Avg Amade TID 71 95 58 NUE 105 55 58 WUN Relative PE Rule 3.5% 3 3.153 $ 255 3.15 21 27 28 25 Avg An Dvd Yeld 155 CAPITAL STRUCTURE as of 65020 1170052057823014124908257352019 2020 2022887371 2225000 2000 Total Assets Sand 115000 LT DE 31701 Duela 5 5150:35 UT Interest 18393403385.0 22503130 20 40 55 2270 1000 Loan Lorennil 50 Nonethen M200 000 6 Noni 72000 Pension Assets-12/19 $20 4 Oblig. 517:10 2009 se 1400 Net Pro 15290 30.12.15 284 270 32 2033 2034 home Tax Rate Pld Stock $300 DE Pid Dvd $1.591 01221 AOL Retur Total Asset 10% co Common Stock 3.647 800.000 shares AMESE MARKET CAP: 129 Large Cap TIENESETAS ASSETSmilt) 2010 2019 2020312520130235 232092 20 Lontoor Assets Loans 971109 946646 9464 10.5 Funds Sold YURT 2 TES Securbes 67 800 16083 355 Acom Other Earning 258450 25% 30 as Alto Prof Other LIABILITIES) BUSINESS Porgan Chase & Cosa franceserve and loans nodding day pa Depos 1470666 1562431 1001029 form with operations in over nations on 6020,wch duelos Mad 24.710 employees on 6/30/20. Directors & Funda Bome 2514 es Merged wh Washing MBOO 70% Operfonal common stock The Vanguard Group Long Term Dei 282031 1446 17003 tions de consumer community and compone 7 Badiod, 679 Proxy, 4201 Charman & James Net Wor 84316261139 26mert banking, con banking and management Demon In De Address 380 Medion Ave, NY, NY 10079. Tel: Other TO 22.037 338 en losses of age or in code anos 212270-4000. Wernet www.parchase.com Loan Loss Res 1344513123 32000 JPMorgan Chase continued to build will expire and commercial loan losses are ANNUAL RATES Post Past Erd"13.10 up its loan los reserve in the June likely to rise, the reserve at mid-2020 may of change ST 2325 quarter. The company made a $10.5 bil already cover a large portion of the loan Loan 8.04 GON lion provision to the reserve to prepare for losses likely in the next several quarters, Earrings 13.54 12.5% 3.0 Dividerids 100 1455 future pandemie-related loan losses. The But revenues probably Book Valve 635 55 CON provision reduced share net by $2.19 com deeline. Investment banking fees are ex- TOLNA 46 55% pared to $1 66 in the March period. After pected to fall back to more normal levels in CAL LOANS) charging off $1.6 billion of loans, the loan the September interim due to seasonal fac de:31 Jun 30 Sep 30 Dec 31 los reserve increased by $8.9 billion tors and the reduction in merger announe 2017 16:6404 S00222917080 Fortunately, JPMorgan logged record in ements to date. The moderation in mar 2018 121040 935164 4118 971109 vestment banking and trading revenues keta activity in late June is expected to 2018 42712 0723 01963 AB as many commercial clients raised funds continue, and markets revenues will face 2030 942131 QUAM 45000 and in the early days of the pandemic and tough year-to-year comparisons in the see 2001 000 000 HASO001000000 market conditions improved. The surge in ond half Low interest rates and loan LARNINGS PER SHARE revenues helped offset the negative effect paydowns, along with lackluster demand Mar 31 Jun 30 Sep 30 Dec 31 Year of the sizable provision on the bottom line for credit, appear to be taking a toll on 2017 15 1.70 We assume loan loss provisions will loan yields and net interest income. In all, 2018 237 23 234 19 2019 265 282 2.57 1072 Under new accounting methodolog, loan 2020, but stage a partial recovery in 2021 2020 78 1.38 160 2021 1 2.10 2:35 4.00 timates of loan losses over the life of weather the current crisis. The compa QUARTERLY DIVIDENDS PAD F loan, taking the economic outlook into a ny is in good shape with regard to equity Mar 31 June 30 Dec 1 Your count. The provision in the June term was capital, which the company managed to 2016 2017 50 56 20 than in the March period, in which a hefty loan loss provision. The common div 2018 5660 24 broader range of commercial borrowers idend looks safe for now. But the stock 2014 80 300 3.8 might struggle in protracted downturn. doesn't stand out for the pull to 2023-2025. Alih numer loan deferral programa Theresa Brophy August 7, 2020 aleo 20 3988 88888 Below is a summary Table (p 419) for estimates of intrinsic value (V2012) of Chevron using Value Line Investment Survey report and other financial data. As we have learned in detail in Chapter 13, the estimates are calculated based on three alternative valuation models (Dividend Discount Model (DDM), P/E (or earnings multiple terminal value) approach, and Free Cash Flow (FCF) model). Summary We have now valued Chevron using several approaches with estimates of intrinsic value as follows: Page 119 Model Intrinsic Value Two-stage dividend discount model $112.32 DDM with earnings multiple terminale 110.10 Three-stage DUM $701 Free cash flow to the form 138.12 Free cash flow to equity ) 131.54 Market price in 2017 111.12 (1) Using Excel, show your calculations of estimates of intrinsic value (V2020) for your Company in detail. First, create six Excel Worksheets entitled Summary, 2SDDM, DDMPE, 3SDDM, FCFF, and FCFE, respectively. For calculations, replicate all assumptions used for the data, step-by-step calculations, and relevant Spreadsheets (13.1, and 13.2) in Chapter 13. Also, for each Worksheet, you organize data first (data section), and then calculate numbers (calculation section). Show data section with your explicit explanation where you get the data. Show calculation section with your explicit explanation on textbook equations you are using for calculations. (2) Produce the same Table showing your estimates of intrinsic value (V2020) for your Company based on alternative model (or approaches) explained in Chapter 13, and report the Table in Summary Worksheet. (3) Explain your reason why the estimates in (1) are all different and how you handle the situation as a financial analyst. JPMORGAN CHASE NYSE.JPM 96.90 18.5 0.84 3.7% LOW 1373 shares RECENT PIE PRICE Training 13.1 RELATIVE DIVD RATIO VALUE Median: 11.0 PE RATIO YLD TIMELINESS 3 Lowered 102/19 High: 47.5 LINE 482 48.4 46.5 15.0 58.6 63,5 352 70.6 87.4 27.8 108.5 119.3 140.1 141.1 SAFETY 1 Raised 8720 30.8 44.2 53.0 50.1 LEGENDS 52.5 81.6 91.1 959 76.9 Target Price Range 2023 2024 2025 TECHNICAL 3 Lowered 5820 11.0 x Eaming psh . Relative Price Strength Options Yes BETA 110 (1.00 Marat 200 Shaded windows 160 18-Month Target Price Range Low-High Midpoint (% to Mid) 100 80 $75-8170 $123 (25) 60 2023-25 PROJECTIONS 50 Ann'l Total 40 Price Gain Return 30 High 125 ( 10N Low 165 $183 6% Institutional Decisions % TOT. RETURN 620 30211 400019 102.000 THIS VL ARTH Percent 30 to Buy 1186 1358 STOCK INDEX 20 -13.7 -5. ta sel 1183 1241 1359 traded 10 3 yr 10.9 68 d.2001229872622762742191416 5 y 58.0 2004 2005 2006 2007 2008 2009 2010 2011 2012 2013 2014 2015 2016 2017 2018 2019 2020 2021 VALUE LINE PUB. LLC 23-25 286 2.95 3.82 4.38 84 2.24 3.96 4.48 5.20 4.35 529 6.00 6.19 6.87 9.00 10.72 5.25 8.00 Earnings per sh 10.50 1.36 1.36 136 1.48 152 20 20 1.00 1.20 1.44 158 1.72 188 2.12 2.72 3.40 3.60 Olds Decl'd per sh 4.00 29.61 30.71 33.45 36.50 36.15 39.88 43.04 46.60 51.27 53.25 57.08 60.46 64.06 6704 70.35 75.98 78.25 82.90 Book Value per sho 101.10 36562 34867 3461733674378823203910,3377188603.53756,11371405063.5612305312752330600 3070.0 Common Shs Outstgo 3150.0 13.5 122 11.5 10.9 ME 158 10.2 8.8 75 119 110 10 106 134 123 107 Boldres e Avg Ann PE Ratio 11.0 71 65 62 58 NMF 1.05 165 55 48 .67 58 53 56 67 66 58 Vale Line Relative PE Ratio .70 3.5% 3.8% 3.1% 3.15 3.8% .8% 5% 25% 3.1% 2.8% estimates 2.7% 2.7% 2.9% 23% 25% 30% Avg Ann' Did Yield 355 CAPITAL STRUCTURE as of 6/30/20 3117605 2265792 2359141 2415689 2573126 2351698 2490972 2533600 2622532 2687379 3225000 3350000 Total Assets (Smilt) 35000W 66066166111711860 722154 743151 823744 B809e9 917096 971109 946646 950000 10000 Loans (Smil) 1150000 LT Debt $317.0 bil Due in 5 yrs $1593 bil 51001 47689 44910 43319 43634 43510 46083 50097 55059 57245 56000 58000 Net Interest Inc (Smill) 600 LT Interest $6.6 bil. 16639757403385.0 2250 3139.0 3827053610 5290.048710 5586.0 22750 8000 Loan Loss Prov'n (Smil) 11000 51693 49545 52121 53287 50571 5003349585 48882 53970 53382 60800 56000 Noninterest Inc (Smill) 64000 61196 62911 647297016761274 5901455771 58434 6339465197 65000 67500 Noninterest Exp (Smill) 74000 17370 18976 21284 17923 21782 24442 24733 26481 32474 36131 Pension Assets-12/19 $20.4 bill Oblig. $17.1 bill 17850 35200 26400 Net Profit (Smil) 30.1% 29.15 264% 30.8% 27.0% 204% 28,4% 249% 20.3% 182% 20.0% 20.0% Income Tax Rate 20.0% Pld Stock $30.063 bil Pad Divd $1.631 bill. 82% 85% 90% 749 85% 1.04% 99% 1.06% 1.24% 1.36% 55% 80% Return on Total Assels 1.00% 125000 Common Stock 3,047,600,000 shares 247669 256775 249024 267889 276836 288651 295245 284080 282031 291498 325000 350000 Long Term Debt (Smill) 176106 189573 204069 211178 232066 247573 254190 255698 256515 261330 268750 284550 Sht. Equity (Smil) 338450 8.3% 8.15 MARKET CAP: $295 bill. (Large Cap) 87% 9.5% 8.7% 9.85 9.0% 105% 10.2% 101% 9.8% 8.5% Shr. Eq.to Total Assets 3.10 2.5% 1 + @ v 9.8% 6.9% A Read aloud Draw MARKET CAP: $295 bill. (Large Cap) Highlight 8.3% 8.1% 8.7% 87% 9.0% ASSETS(Smili.) 10.5% 10.2% 2018 2019 6/30/20 10.1% 9.8% 8.5% 31.2% 30.7% 30.2% 299% 28.9% 35.0% 35.4% 362% 8.5% Shr. Eq. to Total Assets 9.5% Loans 971109 946646 946426 37.0% 352% 29.5% 30,0% Loans to Tot Assets Funds Sold 321588 388915 399684 9.9% 10.3% 10.4% 8.5% 330% 9.4% 99% 9.7% 10.4% 12.7% 13.99 Securities 6.5% 787537 809342 1084833 9.5% Return on Shr. Equity 8.1% 105% Other Earning 8.2% 58% 256469 241927 473185 74% 7.5% 10.8% 1029% 9% 25% 2.05 55% Retained to Com Eq Other 285829 300549 308987 25% 36% 65% 33% 33% 35% 35% 33% 34% 70% 48% All Divds to Net Prof LIABILITIES(Smill.) 40% BUSINESS: JPMorgan Chase & Co is a global financial services reserve. 3.28% of fans; nonaccrual loans (excluding 90-day past Deposits 1470666 1562431 1931029 firm with operations in over 60 nations. On 6/30/20, 4923 branch due) 82%. Had 256.710 employees on 6/30/20. Directors & of Funds Borrowed 251506 224595 283661 Long-Term Debt 282031 291498 317003 es. Merged with Washington Mutual, 908; Bank One, 7/04. Opera- ficers own less than 1% of common stock: The Vanguard Group, Net Worth 256515 261330 264466 tions include consumer & community banking, corporate & Invest 79% BlackRock, 6.7% (Proxy, 420). Chairman & CEO: James Other 361724 347525 416956 mont banking, commercial banking, and asset management. Not Dimon, Inc.: DE Address: 383 Madison Ave., NY, NY 10079. Tel.: Total 2622532 2687379 32131116 loan losses: 61% of average loans in 19. On 6/30/20, loan loss 212-270-6000. Internet: www.jpmorganchase.com Loan Loss Rosry 13445 13123 32092 JPMorgan Chase continued to build will expire and commercial loan losses are ANNUAL RATES Past Past Estd 17-19 up its loan loss reserve in the June likely to rise, the reserve at mid-2020 may of change per shi 10 Yrs. 5 Yrs to 23-25 Loans quarter. The company made a $10.5 bil- already cover a large portion of the loan 4.5% 6.0% 6.0% Earnings 13.5% 12,5% 3.0% lion provision to the reserve to prepare for losses likely in the next several quarters. Dividends 10.0% 14.5% 6.5% future pandemic-related loan losses. The But revenues Book Value will probably also 6.5% 6.0% 5.5% Total Assets 4.5% provision reduced share net by $2.19 com- decline. Investment banking fees are ex- 4.5% 5.5% pared to $1.66 in the March period. After pected to fall back to more normal levels in Cal LOANS ($ mill) charging off $1.6 billion of loans, the loan the September interim due to seasonal fac- endar Mar 31 Jun 30 Sep 30 Dec.31 loss reserve increased by $8.9 billion tors and the reduction in merger announc- 2017 882561 895404 900222 917093 Fortunately, JPMorgan logged record in ements to date. The moderation in mar- 2018 921049 935164 941190 971109 vestment banking and trading revenues, kets activity in late June is expected to 2019 942712 943723 931983 946646 as many commercial clients raised funds continue, and markets revenues will face 2020 992131 946426 945000 950000 in the early days of the pandemic and tough year-to-year comparisons in the sec- 2021 950000 965000 985000 1000000 market conditions improved. The surge in ond half. Low interest rates and loan Cat EARNINGS PER SHARE A Full revenues helped offset the negative effect paydowns, along with lackluster demand endar Mar.31 Jun 30 Sep.30 Dec.31 Year of the sizable provision on the bottom line. for credit, appear to be taking a toll on 2017 1.65 1.70 1.76 1.76 6.87 We assume loan loss provisions will loan yields and net interest income. In all, 2018 2.37 2.29 2.34 1.98 9.00 fall meaningfully in the second half. we look for earnings to fall sharply in 2019 2.65 2.82 2.68 257 10.72 Under new accounting methodology, loan 2020, but stage a partial recovery in 2021 2020 .78 1.38 1.40 1.69 5.25 loss provisions reflect banks' best es- JPMorgan seems well-positioned to 2021 1.75 1.90 2.10 2.25 8.00 timates of loan losses over the life of a weather the current crisis. The compa- Cal QUARTERLY DIVIDENDS PAID Full loan, taking the economic outlook into ac ny is in good shape with regard to equity endar Mar 31 Jun 30 Sep.30 Dec.31 Year count. The provision in the June term was capital, which the company managed to 2016 44 44 48 1.84 based on a more conservative scenario add to in the June quarter, in spite of the 2017 48 2.04 than in the March period, in which a hefty loan loss provision. The common diy 2018 Sut the stock 56 56 idend looks safe for now. 2.48 broader range of commercial borrowers 2019 80 3.30 might struggle in a protracted downturn. doesn't stand out for the pull to 2023-2025. 2020 90 August 7, 2020 90 Although consumer loan deferral programs Theresa Brophy (A) Dilud oamings, Quarterly earnings por continued operation 06, SD.17 Excl. ex Westment plan av labi, (C) Inel intinpbles Company's Financial Strength Stock's Price Stability 90 share in '18 do not sum due to rounding. Extraordinary gain 08 $0.53:09. $0.02 Next on 6/30/20, $517 bil. $1695/sh (oh mi- Price Growth Persistence cludes unusual expenses '04 $1,31 05, camins roport mid Oct (3) Dividends histori lions Earnings Predictability 75 $0.57 '17 $0.56. Excludes income from difcally paid late Jan Apr Juy, Od Divd roin 8888 8888 Mailings Review View Help om 11 A A A A E 2 ab X, X AD A E. AaBbccd AaBbced AaBC AaBbcc AaBC AaBbcc AabCcDd Ao8bccd. 1 Normal 1 No Spac... Heading 1 Heading 2 Title Subtitle Subtle Em... Emphasis Font Paragraph Styles Below is a summary Table (p 419) for estimates of intrinsic value (V2017) of Chevron using Value Line Investment Survey report and other financial data. As we have learned in detail in Chapter 13, the estimates are calculated based on three alternative valuation models (Dividend Discount Model (DDM), P/E (or earnings multiple terminal value) approach, and Free Cash Flow (FCF) model). Summary We have now valued Chevron using several approaches, with estimates of intrinsic value as follows: Page 419 Model Intrinsic Valse Two-stage dividend discount model $112.32 DDM with earnings multiple terminal value 110.70 Three stage DDM 87.01 Free cash flow to the fim 138.12 Free cash flow to equity 131.54 Market price in 2017 TIL.72 rec Design Layout References Mason Mailings Review View Help w Rome 11 A A A A 21 U XX A DATE Normat 1 No Spac Heading Heading 2 Subtitle Subtle Em Emphasis Title Font Parap Styles Free cash flow to the firm 138.12 Free cash flow to equity 131.54 Market price in 2017 111.72 (1) Using Excel, show your calculations of estimates of intrinsic value (V2020) for your Company in detail. First, create six Excel Worksheets entitled Summary, 2SDDM, DDMPE, 3SDDM, FCFF, and FCFE, respectively. For calculations, replicate all assumptions used for the data, step-by-step calculations, and relevant Spreadsheets (13.1, and 13.2) in Chapter 13. Also, for each Worksheet, you organize data first (data section), and then calculate numbers (calculation section). Show data section with your explicit explanation where you get the data. Show calculation section with your explicit explanation on textbook equations you are using for calculations. (2) Produce the same Table showing your estimates of intrinsic value (V2020.) for your Company based on alternative model (or approaches) explained in Chapter 13, and report the Table in Summary Worksheet. (3) Explain your reason why the estimates in (1) are all different and how you handle the situation as a financial analyst Droon Mailings Review View Help E 21 EIE d bccDd 1 Normal 1 No Spac.. Heading 1 Heading 2 Title Sub Y Paragraph Styles Below is a summary Table (p 419) for estimates of intrinsic value (2012) of Chevron using Value Line Investment Survey report and other financial data. As we have learned in detail in Chapter 13, the estimates are calculated based on three alternative valuation models (Dividend Discount Model (DDM), P/E (or earnings multiple terminal value) approach, and Free Cash Flow (FCF) model). Summary We have now valued Chevron using several approaches, with estimates of intrinsic value as follows: Page 419 Model Two-stage dividend discottidel $112.32 DDM with earnings tipe terminale 100.70 Thaceae DDM STOI Free enth fow to the fim 13.12 Free cash flow to 3154 Market price in 2017 11.12 (1) Using Excel, show your calculations of estimates of intrinsic value (V220) for your Company in detail. First, create six Excel Worksheets entitled Summary, 2SDDM, DDMPE, 3SDDM, FCFF, and FCFE, respectively. For calculations, replicate all assumptions used for the data, step-by-step calculations, and relevant Spreadsheets (13.1, and 13.2) in Chapter 13. Also, for each Worksheet, you organize data first (data section), and then calculate numbers (calculation section). Show data section with your explicit explanation where you get the data. Show calculation section with your explicit explanation on textbook equations you are using for calculations. (2) Produce the same Table showing your estimates of intrinsic value (Vox) for your Company based on alterative model (or approaches) explained in Chapter 13, and report the Table in Summary Worksheet. (3) Explain your reason why the estimates in (1) are all different and how you handle the situation as a financial analyst. (4) Upload your Excel Workbook. Bi E JPMORGAN CHASE NYSE_SH PRO 96.90 Kino 18.50 3.7% 89 889 Price 01 E PE DVD VALUE TU) PERATO LINE TIMELINESS 3 Lovered 102519 High 47542 44 100.1111 15.0352 300 442 950 789 Target Price Range SAFETY LEGENDS 2003 2024 2025 10 E TECHNICAL 3 L5% ngh -200 BETA (100 18-Month Target Price Range Low High Midpoint to id) 575-51703123254 2003-25 PROJECTIONS AT Heur High 125 (-30%) 10% Low 106 1.10% -20 Institutional Decisions TOT. RETURN $20 HAR 2011 ICE w 135 AM 133 shares 1241 1350 3 199 2004 2005 2006 2007 2008 2009 2010 2011 2012 2013 2014 2015 2016 2017 2016 2010 2020 2021TLLEUNERIA UE323 2. 36 42 224 3.86 2 520 435 61 900 1072 5.5 8.0 Enige persh 10.50 13 144 20 20 100 120 1.44 150 172 120 272 340 3.50 100 DI de Deafdpers 40 2.1 3071 24 46.50 5127 5024 5959 80464 7035752 7.25 22.0 Book Value per she 101.10 DEUTEROWHOSEMALIZKUSTEETSETESEADMED Common Shoes 250 TE TEL 109 NU 13:50 45 TU 07 Avg Amade TID 71 95 58 NUE 105 55 58 WUN Relative PE Rule 3.5% 3 3.153 $ 255 3.15 21 27 28 25 Avg An Dvd Yeld 155 CAPITAL STRUCTURE as of 65020 1170052057823014124908257352019 2020 2022887371 2225000 2000 Total Assets Sand 115000 LT DE 31701 Duela 5 5150:35 UT Interest 18393403385.0 22503130 20 40 55 2270 1000 Loan Lorennil 50 Nonethen M200 000 6 Noni 72000 Pension Assets-12/19 $20 4 Oblig. 517:10 2009 se 1400 Net Pro 15290 30.12.15 284 270 32 2033 2034 home Tax Rate Pld Stock $300 DE Pid Dvd $1.591 01221 AOL Retur Total Asset 10% co Common Stock 3.647 800.000 shares AMESE MARKET CAP: 129 Large Cap TIENESETAS ASSETSmilt) 2010 2019 2020312520130235 232092 20 Lontoor Assets Loans 971109 946646 9464 10.5 Funds Sold YURT 2 TES Securbes 67 800 16083 355 Acom Other Earning 258450 25% 30 as Alto Prof Other LIABILITIES) BUSINESS Porgan Chase & Cosa franceserve and loans nodding day pa Depos 1470666 1562431 1001029 form with operations in over nations on 6020,wch duelos Mad 24.710 employees on 6/30/20. Directors & Funda Bome 2514 es Merged wh Washing MBOO 70% Operfonal common stock The Vanguard Group Long Term Dei 282031 1446 17003 tions de consumer community and compone 7 Badiod, 679 Proxy, 4201 Charman & James Net Wor 84316261139 26mert banking, con banking and management Demon In De Address 380 Medion Ave, NY, NY 10079. Tel: Other TO 22.037 338 en losses of age or in code anos 212270-4000. Wernet www.parchase.com Loan Loss Res 1344513123 32000 JPMorgan Chase continued to build will expire and commercial loan losses are ANNUAL RATES Post Past Erd"13.10 up its loan los reserve in the June likely to rise, the reserve at mid-2020 may of change ST 2325 quarter. The company made a $10.5 bil already cover a large portion of the loan Loan 8.04 GON lion provision to the reserve to prepare for losses likely in the next several quarters, Earrings 13.54 12.5% 3.0 Dividerids 100 1455 future pandemie-related loan losses. The But revenues probably Book Valve 635 55 CON provision reduced share net by $2.19 com deeline. Investment banking fees are ex- TOLNA 46 55% pared to $1 66 in the March period. After pected to fall back to more normal levels in CAL LOANS) charging off $1.6 billion of loans, the loan the September interim due to seasonal fac de:31 Jun 30 Sep 30 Dec 31 los reserve increased by $8.9 billion tors and the reduction in merger announe 2017 16:6404 S00222917080 Fortunately, JPMorgan logged record in ements to date. The moderation in mar 2018 121040 935164 4118 971109 vestment banking and trading revenues keta activity in late June is expected to 2018 42712 0723 01963 AB as many commercial clients raised funds continue, and markets revenues will face 2030 942131 QUAM 45000 and in the early days of the pandemic and tough year-to-year comparisons in the see 2001 000 000 HASO001000000 market conditions improved. The surge in ond half Low interest rates and loan LARNINGS PER SHARE revenues helped offset the negative effect paydowns, along with lackluster demand Mar 31 Jun 30 Sep 30 Dec 31 Year of the sizable provision on the bottom line for credit, appear to be taking a toll on 2017 15 1.70 We assume loan loss provisions will loan yields and net interest income. In all, 2018 237 23 234 19 2019 265 282 2.57 1072 Under new accounting methodolog, loan 2020, but stage a partial recovery in 2021 2020 78 1.38 160 2021 1 2.10 2:35 4.00 timates of loan losses over the life of weather the current crisis. The compa QUARTERLY DIVIDENDS PAD F loan, taking the economic outlook into a ny is in good shape with regard to equity Mar 31 June 30 Dec 1 Your count. The provision in the June term was capital, which the company managed to 2016 2017 50 56 20 than in the March period, in which a hefty loan loss provision. The common div 2018 5660 24 broader range of commercial borrowers idend looks safe for now. But the stock 2014 80 300 3.8 might struggle in protracted downturn. doesn't stand out for the pull to 2023-2025. Alih numer loan deferral programa Theresa Brophy August 7, 2020 aleo 20 3988 88888 Below is a summary Table (p 419) for estimates of intrinsic value (V2012) of Chevron using Value Line Investment Survey report and other financial data. As we have learned in detail in Chapter 13, the estimates are calculated based on three alternative valuation models (Dividend Discount Model (DDM), P/E (or earnings multiple terminal value) approach, and Free Cash Flow (FCF) model). Summary We have now valued Chevron using several approaches with estimates of intrinsic value as follows: Page 119 Model Intrinsic Value Two-stage dividend discount model $112.32 DDM with earnings multiple terminale 110.10 Three-stage DUM $701 Free cash flow to the form 138.12 Free cash flow to equity ) 131.54 Market price in 2017 111.12 (1) Using Excel, show your calculations of estimates of intrinsic value (V2020) for your Company in detail. First, create six Excel Worksheets entitled Summary, 2SDDM, DDMPE, 3SDDM, FCFF, and FCFE, respectively. For calculations, replicate all assumptions used for the data, step-by-step calculations, and relevant Spreadsheets (13.1, and 13.2) in Chapter 13. Also, for each Worksheet, you organize data first (data section), and then calculate numbers (calculation section). Show data section with your explicit explanation where you get the data. Show calculation section with your explicit explanation on textbook equations you are using for calculations. (2) Produce the same Table showing your estimates of intrinsic value (V2020) for your Company based on alternative model (or approaches) explained in Chapter 13, and report the Table in Summary Worksheet. (3) Explain your reason why the estimates in (1) are all different and how you handle the situation as a financial analyst. JPMORGAN CHASE NYSE.JPM 96.90 18.5 0.84 3.7% LOW 1373 shares RECENT PIE PRICE Training 13.1 RELATIVE DIVD RATIO VALUE Median: 11.0 PE RATIO YLD TIMELINESS 3 Lowered 102/19 High: 47.5 LINE 482 48.4 46.5 15.0 58.6 63,5 352 70.6 87.4 27.8 108.5 119.3 140.1 141.1 SAFETY 1 Raised 8720 30.8 44.2 53.0 50.1 LEGENDS 52.5 81.6 91.1 959 76.9 Target Price Range 2023 2024 2025 TECHNICAL 3 Lowered 5820 11.0 x Eaming psh . Relative Price Strength Options Yes BETA 110 (1.00 Marat 200 Shaded windows 160 18-Month Target Price Range Low-High Midpoint (% to Mid) 100 80 $75-8170 $123 (25) 60 2023-25 PROJECTIONS 50 Ann'l Total 40 Price Gain Return 30 High 125 ( 10N Low 165 $183 6% Institutional Decisions % TOT. RETURN 620 30211 400019 102.000 THIS VL ARTH Percent 30 to Buy 1186 1358 STOCK INDEX 20 -13.7 -5. ta sel 1183 1241 1359 traded 10 3 yr 10.9 68 d.2001229872622762742191416 5 y 58.0 2004 2005 2006 2007 2008 2009 2010 2011 2012 2013 2014 2015 2016 2017 2018 2019 2020 2021 VALUE LINE PUB. LLC 23-25 286 2.95 3.82 4.38 84 2.24 3.96 4.48 5.20 4.35 529 6.00 6.19 6.87 9.00 10.72 5.25 8.00 Earnings per sh 10.50 1.36 1.36 136 1.48 152 20 20 1.00 1.20 1.44 158 1.72 188 2.12 2.72 3.40 3.60 Olds Decl'd per sh 4.00 29.61 30.71 33.45 36.50 36.15 39.88 43.04 46.60 51.27 53.25 57.08 60.46 64.06 6704 70.35 75.98 78.25 82.90 Book Value per sho 101.10 36562 34867 3461733674378823203910,3377188603.53756,11371405063.5612305312752330600 3070.0 Common Shs Outstgo 3150.0 13.5 122 11.5 10.9 ME 158 10.2 8.8 75 119 110 10 106 134 123 107 Boldres e Avg Ann PE Ratio 11.0 71 65 62 58 NMF 1.05 165 55 48 .67 58 53 56 67 66 58 Vale Line Relative PE Ratio .70 3.5% 3.8% 3.1% 3.15 3.8% .8% 5% 25% 3.1% 2.8% estimates 2.7% 2.7% 2.9% 23% 25% 30% Avg Ann' Did Yield 355 CAPITAL STRUCTURE as of 6/30/20 3117605 2265792 2359141 2415689 2573126 2351698 2490972 2533600 2622532 2687379 3225000 3350000 Total Assets (Smilt) 35000W 66066166111711860 722154 743151 823744 B809e9 917096 971109 946646 950000 10000 Loans (Smil) 1150000 LT Debt $317.0 bil Due in 5 yrs $1593 bil 51001 47689 44910 43319 43634 43510 46083 50097 55059 57245 56000 58000 Net Interest Inc (Smill) 600 LT Interest $6.6 bil. 16639757403385.0 2250 3139.0 3827053610 5290.048710 5586.0 22750 8000 Loan Loss Prov'n (Smil) 11000 51693 49545 52121 53287 50571 5003349585 48882 53970 53382 60800 56000 Noninterest Inc (Smill) 64000 61196 62911 647297016761274 5901455771 58434 6339465197 65000 67500 Noninterest Exp (Smill) 74000 17370 18976 21284 17923 21782 24442 24733 26481 32474 36131 Pension Assets-12/19 $20.4 bill Oblig. $17.1 bill 17850 35200 26400 Net Profit (Smil) 30.1% 29.15 264% 30.8% 27.0% 204% 28,4% 249% 20.3% 182% 20.0% 20.0% Income Tax Rate 20.0% Pld Stock $30.063 bil Pad Divd $1.631 bill. 82% 85% 90% 749 85% 1.04% 99% 1.06% 1.24% 1.36% 55% 80% Return on Total Assels 1.00% 125000 Common Stock 3,047,600,000 shares 247669 256775 249024 267889 276836 288651 295245 284080 282031 291498 325000 350000 Long Term Debt (Smill) 176106 189573 204069 211178 232066 247573 254190 255698 256515 261330 268750 284550 Sht. Equity (Smil) 338450 8.3% 8.15 MARKET CAP: $295 bill. (Large Cap) 87% 9.5% 8.7% 9.85 9.0% 105% 10.2% 101% 9.8% 8.5% Shr. Eq.to Total Assets 3.10 2.5% 1 + @ v 9.8% 6.9% A Read aloud Draw MARKET CAP: $295 bill. (Large Cap) Highlight 8.3% 8.1% 8.7% 87% 9.0% ASSETS(Smili.) 10.5% 10.2% 2018 2019 6/30/20 10.1% 9.8% 8.5% 31.2% 30.7% 30.2% 299% 28.9% 35.0% 35.4% 362% 8.5% Shr. Eq. to Total Assets 9.5% Loans 971109 946646 946426 37.0% 352% 29.5% 30,0% Loans to Tot Assets Funds Sold 321588 388915 399684 9.9% 10.3% 10.4% 8.5% 330% 9.4% 99% 9.7% 10.4% 12.7% 13.99 Securities 6.5% 787537 809342 1084833 9.5% Return on Shr. Equity 8.1% 105% Other Earning 8.2% 58% 256469 241927 473185 74% 7.5% 10.8% 1029% 9% 25% 2.05 55% Retained to Com Eq Other 285829 300549 308987 25% 36% 65% 33% 33% 35% 35% 33% 34% 70% 48% All Divds to Net Prof LIABILITIES(Smill.) 40% BUSINESS: JPMorgan Chase & Co is a global financial services reserve. 3.28% of fans; nonaccrual loans (excluding 90-day past Deposits 1470666 1562431 1931029 firm with operations in over 60 nations. On 6/30/20, 4923 branch due) 82%. Had 256.710 employees on 6/30/20. Directors & of Funds Borrowed 251506 224595 283661 Long-Term Debt 282031 291498 317003 es. Merged with Washington Mutual, 908; Bank One, 7/04. Opera- ficers own less than 1% of common stock: The Vanguard Group, Net Worth 256515 261330 264466 tions include consumer & community banking, corporate & Invest 79% BlackRock, 6.7% (Proxy, 420). Chairman & CEO: James Other 361724 347525 416956 mont banking, commercial banking, and asset management. Not Dimon, Inc.: DE Address: 383 Madison Ave., NY, NY 10079. Tel.: Total 2622532 2687379 32131116 loan losses: 61% of average loans in 19. On 6/30/20, loan loss 212-270-6000. Internet: www.jpmorganchase.com Loan Loss Rosry 13445 13123 32092 JPMorgan Chase continued to build will expire and commercial loan losses are ANNUAL RATES Past Past Estd 17-19 up its loan loss reserve in the June likely to rise, the reserve at mid-2020 may of change per shi 10 Yrs. 5 Yrs to 23-25 Loans quarter. The company made a $10.5 bil- already cover a large portion of the loan 4.5% 6.0% 6.0% Earnings 13.5% 12,5% 3.0% lion provision to the reserve to prepare for losses likely in the next several quarters. Dividends 10.0% 14.5% 6.5% future pandemic-related loan losses. The But revenues Book Value will probably also 6.5% 6.0% 5.5% Total Assets 4.5% provision reduced share net by $2.19 com- decline. Investment banking fees are ex- 4.5% 5.5% pared to $1.66 in the March period. After pected to fall back to more normal levels in Cal LOANS ($ mill) charging off $1.6 billion of loans, the loan the September interim due to seasonal fac- endar Mar 31 Jun 30 Sep 30 Dec.31 loss reserve increased by $8.9 billion tors and the reduction in merger announc- 2017 882561 895404 900222 917093 Fortunately, JPMorgan logged record in ements to date. The moderation in mar- 2018 921049 935164 941190 971109 vestment banking and trading revenues, kets activity in late June is expected to 2019 942712 943723 931983 946646 as many commercial clients raised funds continue, and markets revenues will face 2020 992131 946426 945000 950000 in the early days of the pandemic and tough year-to-year comparisons in the sec- 2021 950000 965000 985000 1000000 market conditions improved. The surge in ond half. Low interest rates and loan Cat EARNINGS PER SHARE A Full revenues helped offset the negative effect paydowns, along with lackluster demand endar Mar.31 Jun 30 Sep.30 Dec.31 Year of the sizable provision on the bottom line. for credit, appear to be taking a toll on 2017 1.65 1.70 1.76 1.76 6.87 We assume loan loss provisions will loan yields and net interest income. In all, 2018 2.37 2.29 2.34 1.98 9.00 fall meaningfully in the second half. we look for earnings to fall sharply in 2019 2.65 2.82 2.68 257 10.72 Under new accounting methodology, loan 2020, but stage a partial recovery in 2021 2020 .78 1.38 1.40 1.69 5.25 loss provisions reflect banks' best es- JPMorgan seems well-positioned to 2021 1.75 1.90 2.10 2.25 8.00 timates of loan losses over the life of a weather the current crisis. The compa- Cal QUARTERLY DIVIDENDS PAID Full loan, taking the economic outlook into ac ny is in good shape with regard to equity endar Mar 31 Jun 30 Sep.30 Dec.31 Year count. The provision in the June term was capital, which the company managed to 2016 44 44 48 1.84 based on a more conservative scenario add to in the June quarter, in spite of the 2017 48 2.04 than in the March period, in which a hefty loan loss provision. The common diy 2018 Sut the stock 56 56 idend looks safe for now. 2.48 broader range of commercial borrowers 2019 80 3.30 might struggle in a protracted downturn. doesn't stand out for the pull to 2023-2025. 2020 90 August 7, 2020 90 Although consumer loan deferral programs Theresa Brophy (A) Dilud oamings, Quarterly earnings por continued operation 06, SD.17 Excl. ex Westment plan av labi, (C) Inel intinpbles Company's Financial Strength Stock's Price Stability 90 share in '18 do not sum due to rounding. Extraordinary gain 08 $0.53:09. $0.02 Next on 6/30/20, $517 bil. $1695/sh (oh mi- Price Growth Persistence cludes unusual expenses '04 $1,31 05, camins roport mid Oct (3) Dividends histori lions Earnings Predictability 75 $0.57 '17 $0.56. Excludes income from difcally paid late Jan Apr Juy, Od Divd roin 8888 8888 Mailings Review View Help om 11 A A A A E 2 ab X, X AD A E. AaBbccd AaBbced AaBC AaBbcc AaBC AaBbcc AabCcDd Ao8bccd. 1 Normal 1 No Spac... Heading 1 Heading 2 Title Subtitle Subtle Em... Emphasis Font Paragraph Styles Below is a summary Table (p 419) for estimates of intrinsic value (V2017) of Chevron using Value Line Investment Survey report and other financial data. As we have learned in detail in Chapter 13, the estimates are calculated based on three alternative valuation models (Dividend Discount Model (DDM), P/E (or earnings multiple terminal value) approach, and Free Cash Flow (FCF) model). Summary We have now valued Chevron using several approaches, with estimates of intrinsic value as follows: Page 419 Model Intrinsic Valse Two-stage dividend discount model $112.32 DDM with earnings multiple terminal value 110.70 Three stage DDM 87.01 Free cash flow to the fim 138.12 Free cash flow to equity 131.54 Market price in 2017 TIL.72 rec Design Layout References Mason Mailings Review View Help w Rome 11 A A A A 21 U XX A DATE Normat 1 No Spac Heading Heading 2 Subtitle Subtle Em Emphasis Title Font Parap Styles Free cash flow to the firm 138.12 Free cash flow to equity 131.54 Market price in 2017 111.72 (1) Using Excel, show your calculations of estimates of intrinsic value (V2020) for your Company in detail. First, create six Excel Worksheets entitled Summary, 2SDDM, DDMPE, 3SDDM, FCFF, and FCFE, respectively. For calculations, replicate all assumptions used for the data, step-by-step calculations, and relevant Spreadsheets (13.1, and 13.2) in Chapter 13. Also, for each Worksheet, you organize data first (data section), and then calculate numbers (calculation section). Show data section with your explicit explanation where you get the data. Show calculation section with your explicit explanation on textbook equations you are using for calculations. (2) Produce the same Table showing your estimates of intrinsic value (V2020.) for your Company based on alternative model (or approaches) explained in Chapter 13, and report the Table in Summary Worksheet. (3) Explain your reason why the estimates in (1) are all different and how you handle the situation as a financial analyst Droon