

Answered step by step
Verified Expert Solution
Question
1 Approved Answer
Can someone help me with all the questions as soon as possible please, thank you. A firm has been experiencing low profitability in recent years.
Can someone help me with all the questions as soon as possible please, thank you.
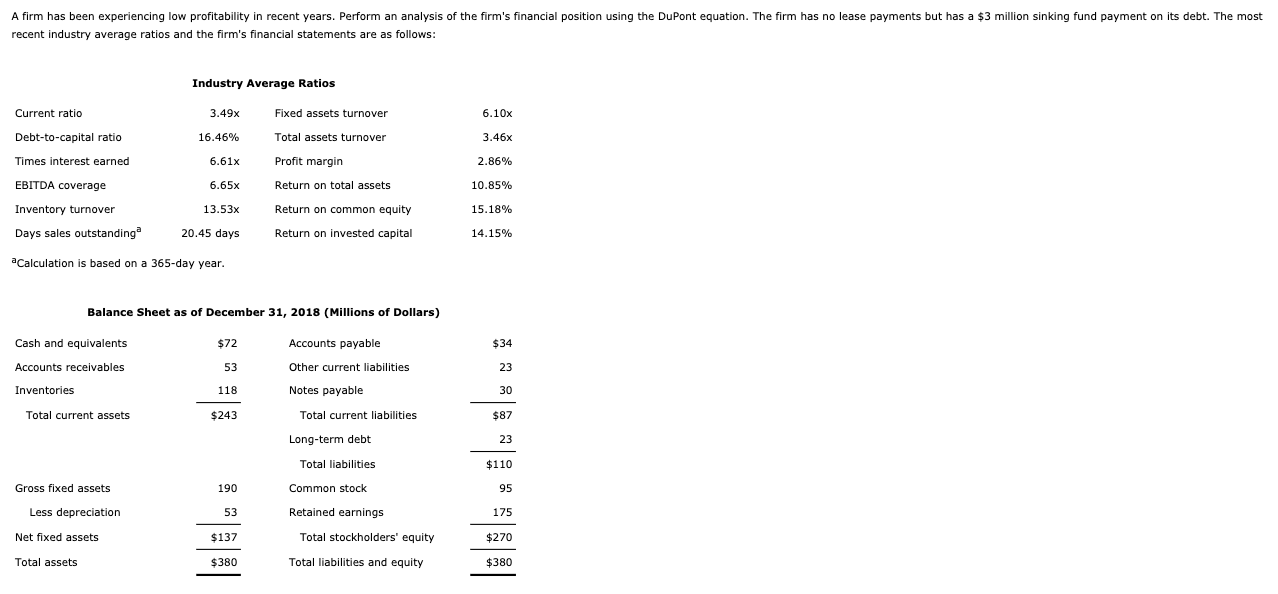
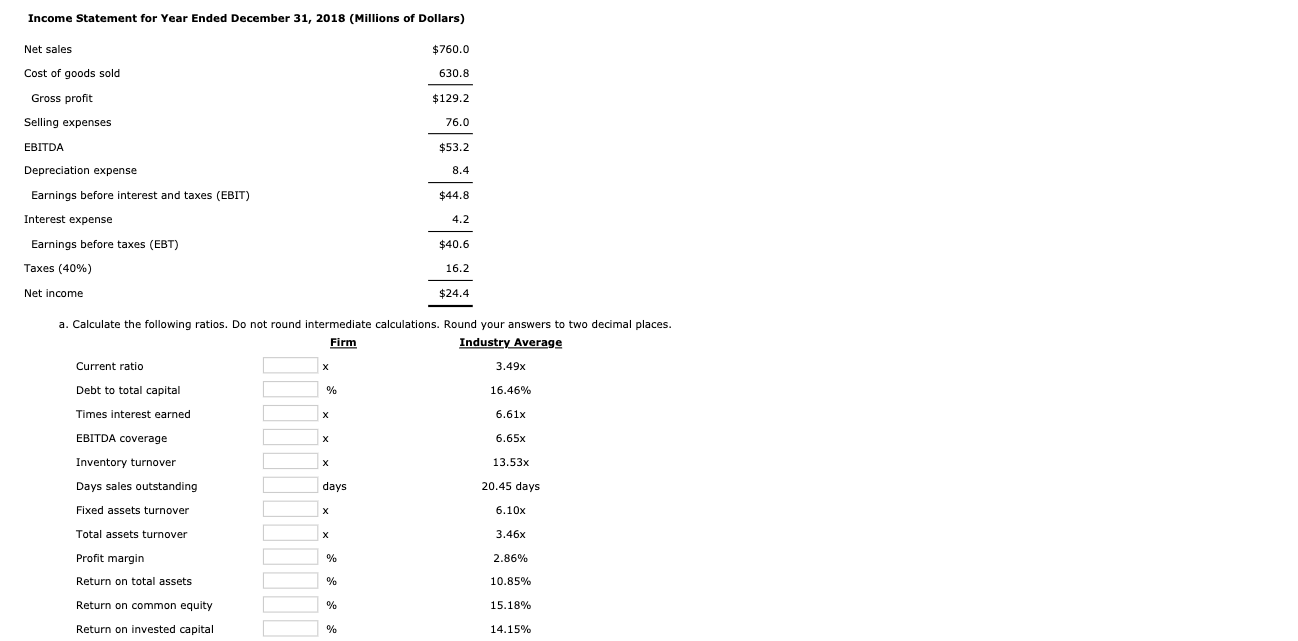
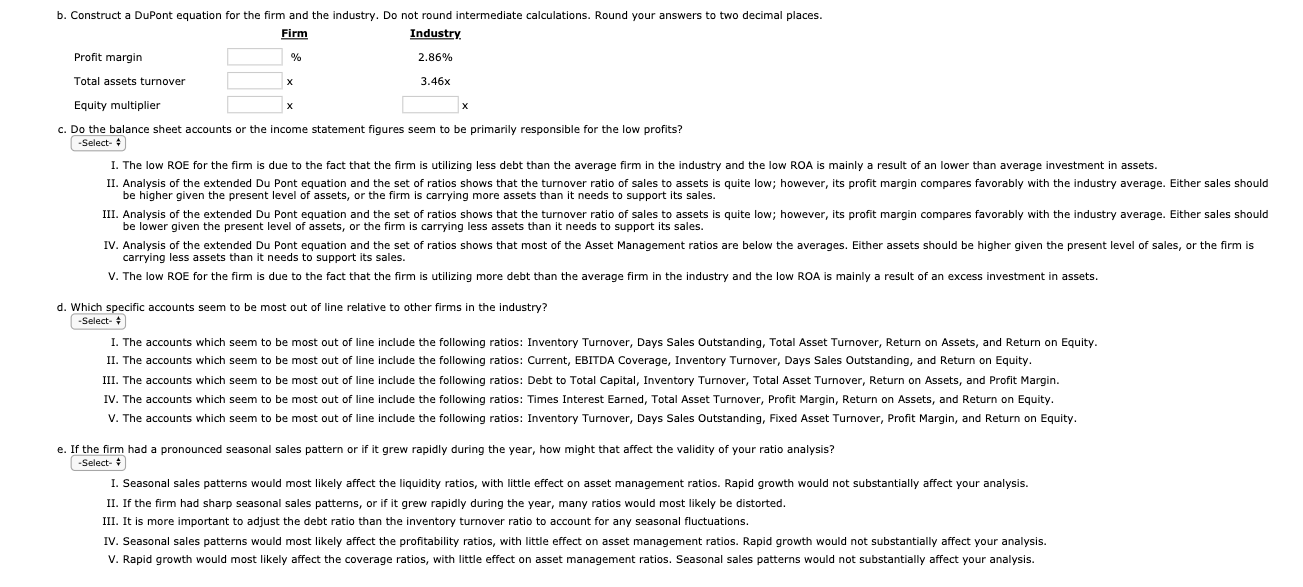
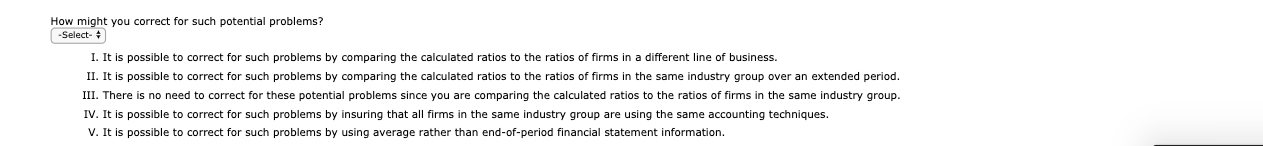
A firm has been experiencing low profitability in recent years. Perform an analysis of the firm's financial position using the DuPont equation. The firm has no lease payments but has a $3 million sinking fund payment on its debt. The most recent industry average ratios and the firm's financial statements are as follows: Industry Average Ratios Current ratio 3.49x 6.10x Fixed assets turnover Total assets turnover Debt-to-capital ratio 16.46% 3.46x Times interest earned 6.61x Profit margin 2.86% 6.65x Return on total assets 10.85% EBITDA coverage Inventory turnover Days sales outstandinga Return on common equity 15.18% 13.53x 20.45 days Return on invested capital 14.15% Calculation is based on a 365-day year. Balance Sheet as of December 31, 2018 (Millions of Dollars) Cash and equivalents Accounts receivables $72 53 118 Accounts payable Other current liabilities Notes payable Total current liabilities Inventories Total current assets $243 Long-term debt Total liabilities Gross fixed assets 190 Common stock Less depreciation 53 Retained earnings 175 Net fixed assets $137 Total stockholders' equity $270 Total assets $380 Total liabilities and equity $380 Income Statement for Year Ended December 31, 2018 (Millions of Dollars) Net sales $760.0 Cost of goods sold 630.8 $129.2 Gross profit Selling expenses 76.0 EBITDA $53.2 Depreciation expense 8.4 Earnings before interest and taxes (EBIT) $44.8 Interest expense 4.2 Earnings before taxes (EBT) Taxes (40%) $40.6 16.2 Net income $24.4 a. Calculate the following ratios. Do not round intermediate calculations. Round your answers to two decimal places. Firm Industry Average Current ratio 3.49x Debt to total capital 16.46% Times interest earned 6.61x EBITDA coverage 6.65x Inventory turnover 13.53x days 20.45 days Days sales outstanding Fixed assets turnover 6.10x Total assets turnover 3.46x Profit margin 2.86% Return on total assets 10.85% 15.18% Return on common equity Return on invested capital 14.15% b. Construct a DuPont equation for the firm and the industry. Do not round intermediate calculations. Round your answers to two decimal places. Firm Industry Profit margin 2.86% Total assets turnover 3.46x Equity multiplier c. Do the balance sheet accounts or the income statement figures seem to be primarily responsible for the low profits? -Select- I. The low ROE for the firm is due to the fact that the firm is utilizing less debt than the average firm in the industry and the low ROA is mainly a result of an lower than average investment in assets. II. Analysis of the extended Du Pont equation and the set of ratios shows that the turnover ratio of sales to assets is quite low; however, its profit margin compares favorably with the industry average. Either sales should be higher given the present level of assets, or the firm is carrying more assets than it needs to support its sales. III. Analysis of the extended Du Pont equation and the set of ratios shows that the turnover ratio of sales to assets is quite low; however, its profit margin compares favorably with the industry average. Either sales should be lower given the present level of assets, or the firm is carrying less assets than it needs to support its sales. IV. Analysis of the extended Du Pont equation and the set of ratios shows that most of the Asset Management ratios are below the averages. Either assets should be higher given the present level of sales, or the firm is carrying less assets than it needs to support its sales. V. The low ROE for the firm is due to the fact that the firm is utilizing more debt than the average firm in the industry and the low ROA is mainly a result of an excess investment in assets. d. Which specific accounts seem to be most out of line relative to other firms in the industry? -Select- I. The accounts which seem to be most out of line include the following ratios: Inventory Turnover, Days Sales Outstanding, Total Asset Turnover, Return on Assets, and Return on Equity. II. The accounts which seem to be most out of line include the following ratios: Current, EBITDA Coverage, Inventory Turnover, Days Sales Outstanding, and Return on Equity. III. The accounts which seem to be most out of line include the following ratios: Debt to Total Capital, Inventory Turnover, Total Asset Turnover, Return on Assets, and Profit Margin. IV. The accounts which seem to be most out of line include the following ratios: Times Interest Earned, Total Asset Turnover, Profit Margin, Return on Assets, and Return on Equity. V. The accounts which seem to be most out of line include the following ratios: Inventory Turnover, Days Sales Outstanding, Fixed Asset Turnover, Profit Margin, and Return on Equity. e. If the firm had a pronounced seasonal sales pattern or if it grew rapidly during the year, how might that affect the validity of your ratio analysis? -Select- I. Seasonal sales patterns would most likely affect the liquidity ratios, with little effect on asset management ratios. Rapid growth would not substantially affect your analysis. II. If the firm had sharp seasonal sales patterns, or if it grew rapidly during the year, many ratios would most likely be distorted. III. It is more important to adjust the debt ratio than the inventory turnover ratio to account for any seasonal fluctuations. IV. Seasonal sales patterns would most likely affect the profitability ratios, with little effect on asset management ratios. Rapid growth would not substantially affect your analysis. V. Rapid growth would most likely affect the coverage ratios, with little effect on asset management ratios. Seasonal sales patterns would not substantially affect your analysis. How might you correct for such potential problems? -Select- I. It is possible to correct for such problems by comparing the calculated ratios to the ratios of firms in a different line of business. II. It is possible to correct for such problems by comparing the calculated ratios to the ratios of firms in the same industry group over an extended period. III. There is no need to correct for these potential problems since you are comparing the calculated ratios to the ratios of firms in the same industry group. IV. It is possible to correct for such problems by insuring that all firms in the same industry group are using the same accounting techniques. V. It is possible to correct for such problems by using average rather than end-of-period financial statement informationStep by Step Solution
There are 3 Steps involved in it
Step: 1

Get Instant Access to Expert-Tailored Solutions
See step-by-step solutions with expert insights and AI powered tools for academic success
Step: 2

Step: 3
Ace Your Homework with AI
Get the answers you need in no time with our AI-driven, step-by-step assistance
Get Started
Handbook On Second Lien Loans & Intercreditor Agreements
Authors: Mark N. Berman, Jo Ann J. Brighton
1st Edition
0981865593, 978-0981865591