Can someone help me with the times interest earned ratio for Capital one (COF) from 2017 to 2020?
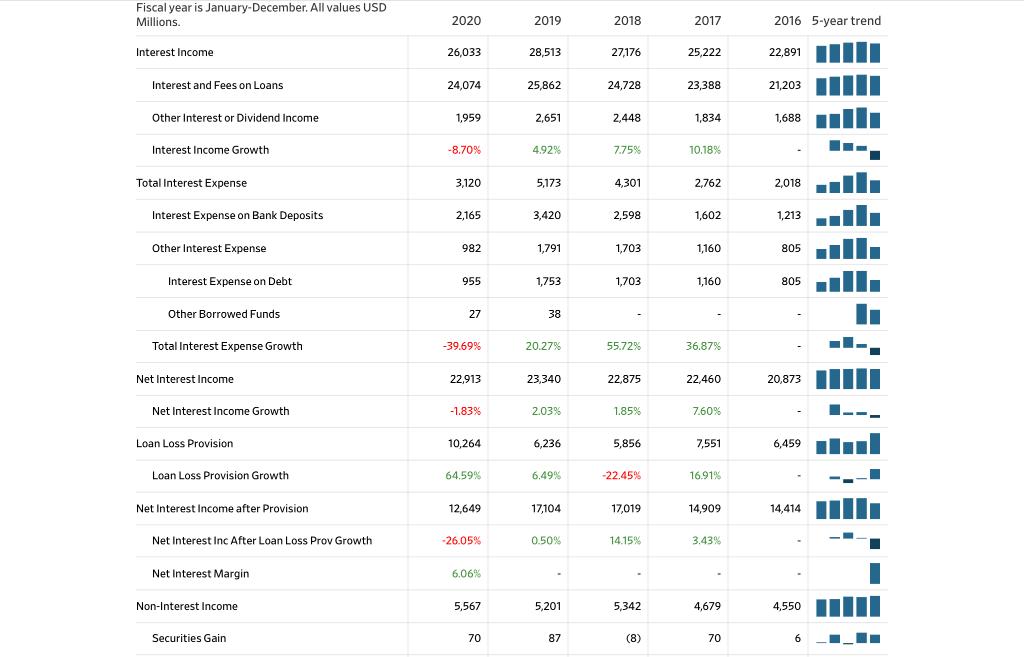
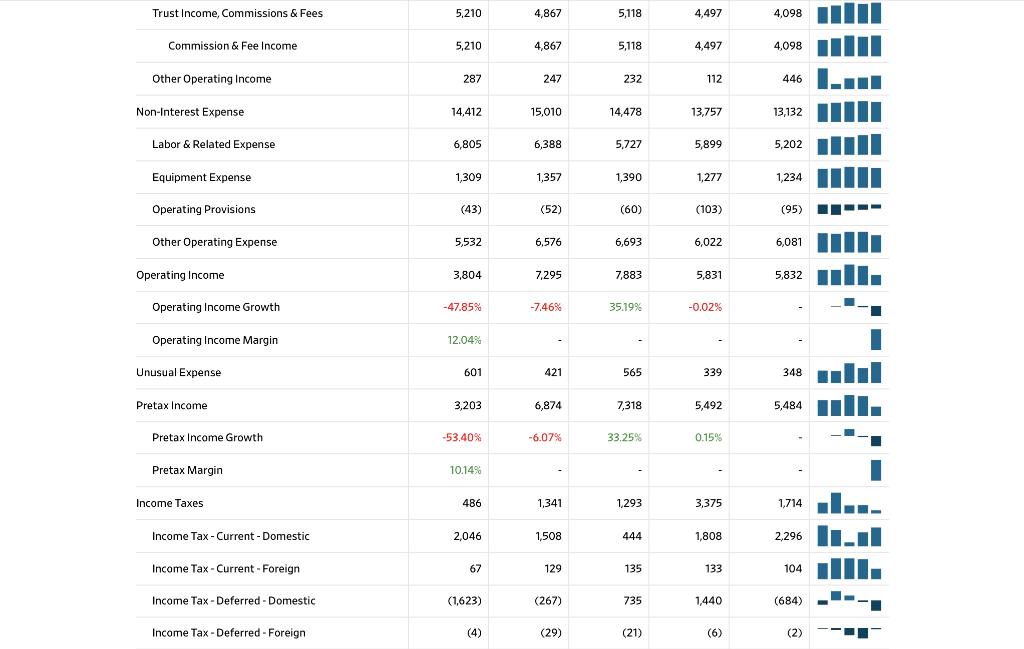
Fiscal year is January-December. All values USD Millions. 2020 2019 2018 2017 2016 5-year trend Interest Income 26,033 28,513 27,176 25,222 22,891 Interest and Fees on Loans 24,074 25,862 24,728 23,388 21,203 Other Interest or Dividend Income 1,959 2,651 2,448 1,834 1,688 Interest Income Growth -8.70% 4.92% 7.75% 10.18% Total Interest Expense 3.120 5,173 4.301 2,762 2,018 Interest Expense on Bank Deposits 2,165 3,420 2,598 1,602 1,213 Other Interest Expense 982 1,791 1,703 1,160 805 Interest Expense on Debt 955 1,753 1,703 1,160 805 Other Borrowed Funds 27 38 Total Interest Expense Growth -39.69% 20.27% 55.72% 36.87% Net Interest Income 22,913 23,340 22,875 22,460 20,873 Net Interest Income Growth -1.83% 2.03% 1.85% 7.60% Loan Loss Provision 10,264 6,236 5,856 7,551 6,459 Loan Loss Provision Growth 64.59% 6.49% -22.45 16.91% Net Interest Income after Provision 12,649 17,104 17,019 14,909 14,414 Net Interest Inc After Loan Loss Prov Growth -26.05% 0.50% 14.15% 3.43% Net Interest Margin 6.06% Non-Interest Income 5,567 5,201 5,342 4,679 4,550 Securities Gain 70 87 (8) 70 6 I. Trust Income, Commissions & Fees 5,210 4,867 5,118 4,497 4,098 Commission & Fee Income 5,210 4,867 5,118 4,497 4,098 Other Operating Income 287 247 232 112 446 Non-Interest Expense 14,412 15,010 14,478 13,757 13,132 Labor & Related Expense 6,805 6,388 5,727 5,899 5,202 Equipment Expense 1,309 1,357 1,390 1,277 1,234 Operating Provisions (43) (52) (60) (103) (95) Other Operating Expense 5,532 6,576 6,693 6,022 6,081 Operating Income 3,804 7,295 7,883 5,831 5,832 Operating Income Growth -47.85% -7.46% 35.19% -0.02% Operating Income Margin 12.04% - - Unusual Expense 601 421 565 339 348 Pretax Income 3,203 6,874 7,318 5,492 5,484 Pretax Income Growth -53.40% -6.07% 33.25% 0.15% Pretax Margin 10.14% Income Taxes 486 1,341 1,293 3,375 1,714 Income Tax - Current - Domestic 2,046 1,508 444 1,808 2,296 Income Tax - Current - Foreign 67 129 135 133 104 Income Tax-Deferred - Domestic (1,623) (267) 735 1,440 (684) Income Tax-Deferred - Foreign (4) (29) (21) (6) (2) Fiscal year is January-December. All values USD Millions. 2020 2019 2018 2017 2016 5-year trend Interest Income 26,033 28,513 27,176 25,222 22,891 Interest and Fees on Loans 24,074 25,862 24,728 23,388 21,203 Other Interest or Dividend Income 1,959 2,651 2,448 1,834 1,688 Interest Income Growth -8.70% 4.92% 7.75% 10.18% Total Interest Expense 3.120 5,173 4.301 2,762 2,018 Interest Expense on Bank Deposits 2,165 3,420 2,598 1,602 1,213 Other Interest Expense 982 1,791 1,703 1,160 805 Interest Expense on Debt 955 1,753 1,703 1,160 805 Other Borrowed Funds 27 38 Total Interest Expense Growth -39.69% 20.27% 55.72% 36.87% Net Interest Income 22,913 23,340 22,875 22,460 20,873 Net Interest Income Growth -1.83% 2.03% 1.85% 7.60% Loan Loss Provision 10,264 6,236 5,856 7,551 6,459 Loan Loss Provision Growth 64.59% 6.49% -22.45 16.91% Net Interest Income after Provision 12,649 17,104 17,019 14,909 14,414 Net Interest Inc After Loan Loss Prov Growth -26.05% 0.50% 14.15% 3.43% Net Interest Margin 6.06% Non-Interest Income 5,567 5,201 5,342 4,679 4,550 Securities Gain 70 87 (8) 70 6 I. Trust Income, Commissions & Fees 5,210 4,867 5,118 4,497 4,098 Commission & Fee Income 5,210 4,867 5,118 4,497 4,098 Other Operating Income 287 247 232 112 446 Non-Interest Expense 14,412 15,010 14,478 13,757 13,132 Labor & Related Expense 6,805 6,388 5,727 5,899 5,202 Equipment Expense 1,309 1,357 1,390 1,277 1,234 Operating Provisions (43) (52) (60) (103) (95) Other Operating Expense 5,532 6,576 6,693 6,022 6,081 Operating Income 3,804 7,295 7,883 5,831 5,832 Operating Income Growth -47.85% -7.46% 35.19% -0.02% Operating Income Margin 12.04% - - Unusual Expense 601 421 565 339 348 Pretax Income 3,203 6,874 7,318 5,492 5,484 Pretax Income Growth -53.40% -6.07% 33.25% 0.15% Pretax Margin 10.14% Income Taxes 486 1,341 1,293 3,375 1,714 Income Tax - Current - Domestic 2,046 1,508 444 1,808 2,296 Income Tax - Current - Foreign 67 129 135 133 104 Income Tax-Deferred - Domestic (1,623) (267) 735 1,440 (684) Income Tax-Deferred - Foreign (4) (29) (21) (6) (2)