Answered step by step
Verified Expert Solution
Question
1 Approved Answer
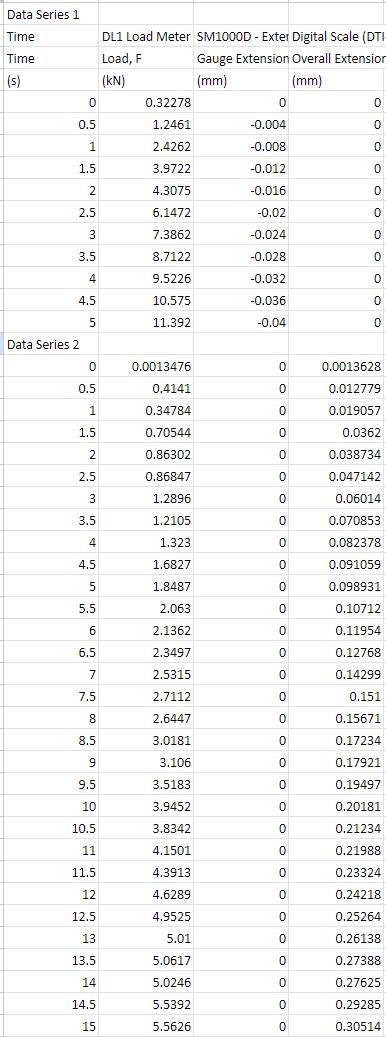
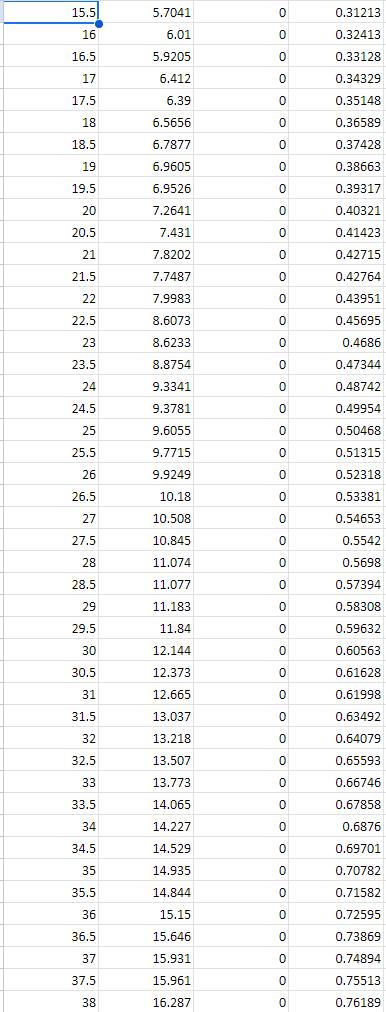
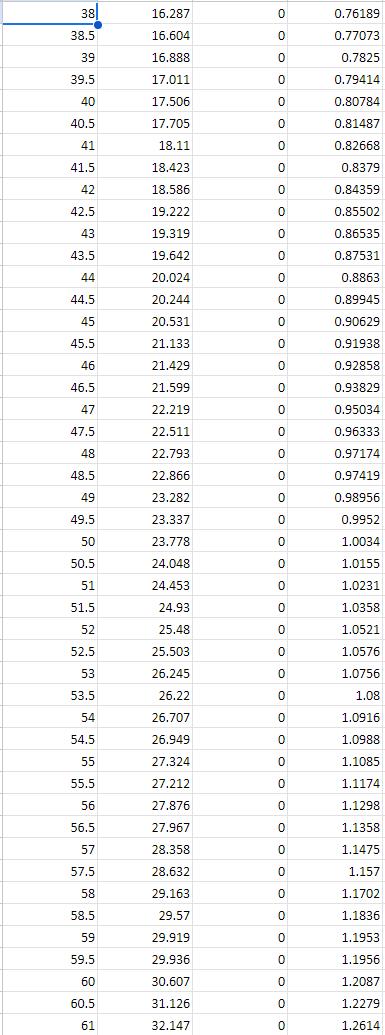
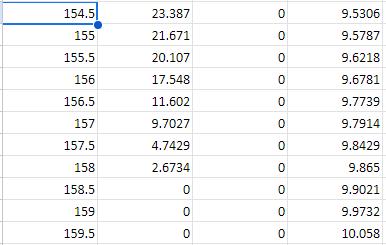
Can someone help me with these questions and how I'm supposed to use the data from this link (https://docs.google.com/spreadsheets/d/1yVW6-f-Y61d4E0rHMpAzWdo8ju-KdC3A6D3H2mEsPxE/edit?usp=sharing) or the data is listed down
Can someone help me with these questions and how I'm supposed to use the data from this link (https://docs.google.com/spreadsheets/d/1yVW6-f-Y61d4E0rHMpAzWdo8ju-KdC3A6D3H2mEsPxE/edit?usp=sharing) or the data is listed down below to answer questions in 4.1.
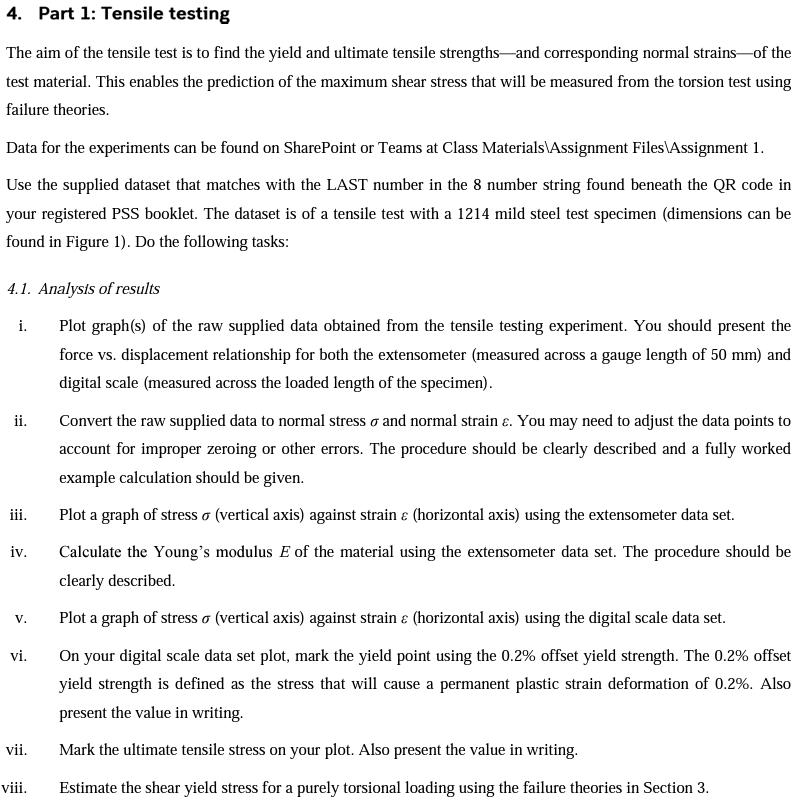
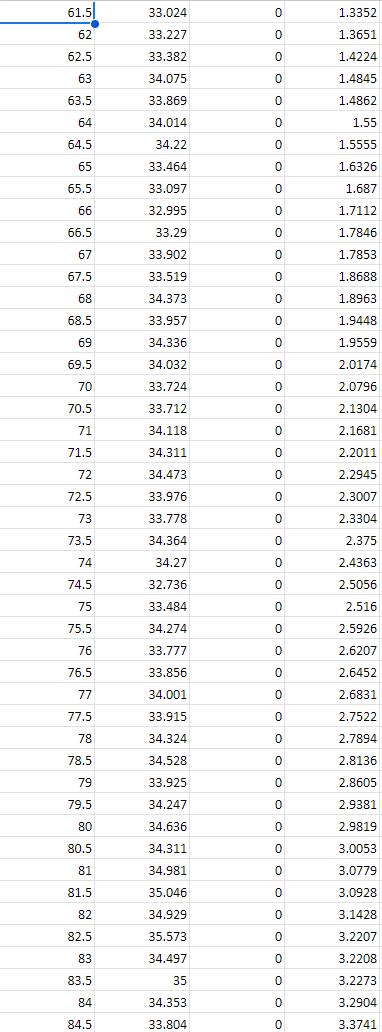
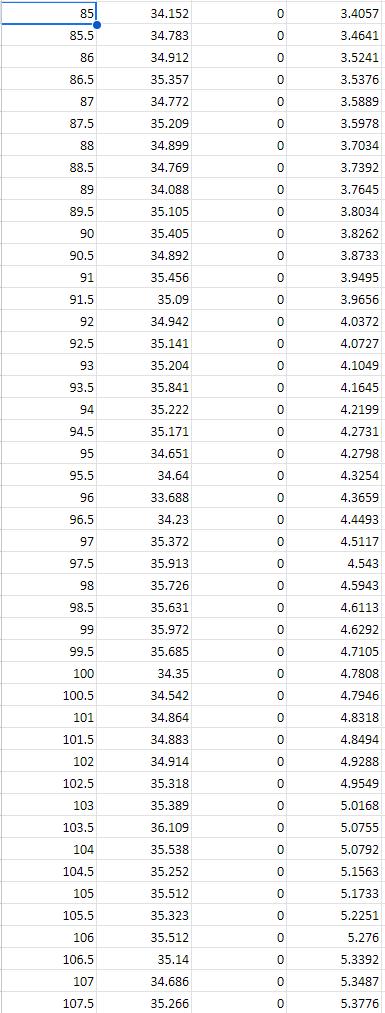
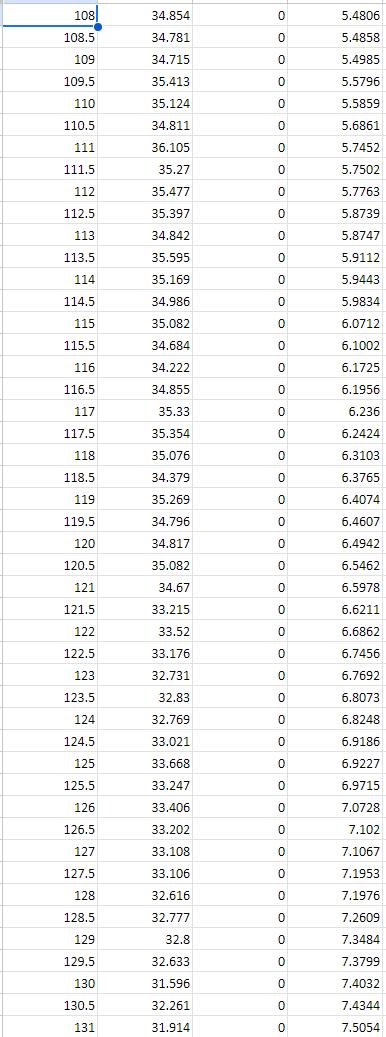
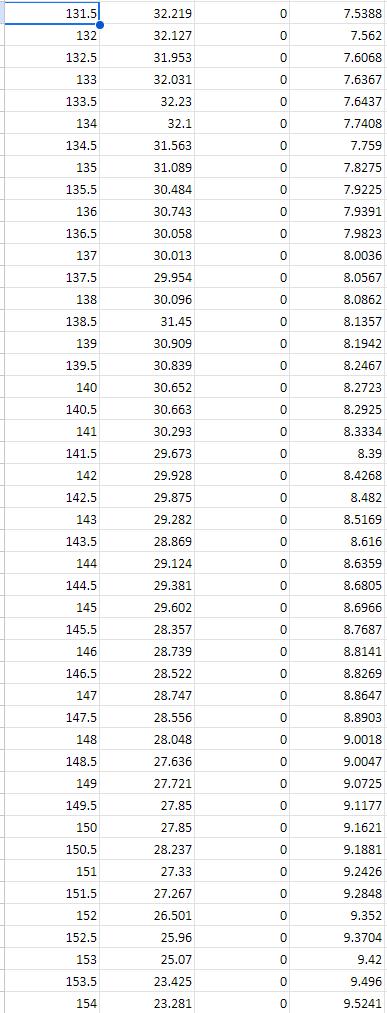
4. Part 1: Tensile testing The aim of the tensile test is to find the yield and ultimate tensile strengths and corresponding normal strains of the test material. This enables the prediction of the maximum shear stress that will be measured from the torsion test using failure theories. Data for the experiments can be found on SharePoint or Teams at Class Materials\Assignment Files\Assignment 1. Use the supplied dataset that matches with the LAST number in the 8 number string found beneath the QR code in your registered PSS booklet. The dataset is of a tensile test with a 1214 mild steel test specimen (dimensions can be found in Figure 1). Do the following tasks: 4.1. Analysis of results i. ii. iii. iv. V. vi. vii. viii. Plot graph(s) of the raw supplied data obtained from the tensile testing experiment. You should present the force vs. displacement relationship for both the extensometer (measured across a gauge length of 50 mm) and digital scale (measured across the loaded length of the specimen). Convert the raw supplied data to normal stress and normal strain c. You may need to adjust the data points to account for improper zeroing or other errors. The procedure should be clearly described and a fully worked example calculation should be given. Plot a graph of stress (vertical axis) against strain & (horizontal axis) using the extensometer data set. Calculate the Young's modulus E of the material using the extensometer data set. The procedure should be clearly described. Plot a graph of stress (vertical axis) against strain & (horizontal axis) using the digital scale data set. On your digital scale data set plot, mark the yield point using the 0.2% offset yield strength. The 0.2% offset yield strength is defined as the stress that will cause a permanent plastic strain deformation of 0.2%. Also present the value in writing. Mark the ultimate tensile stress on your plot. Also present the value in writing. Estimate the shear yield stress for a purely torsional loading using the failure theories in Section 3.
Step by Step Solution
There are 3 Steps involved in it
Step: 1

Get Instant Access to Expert-Tailored Solutions
See step-by-step solutions with expert insights and AI powered tools for academic success
Step: 2

Step: 3

Ace Your Homework with AI
Get the answers you need in no time with our AI-driven, step-by-step assistance
Get Started


