Answered step by step
Verified Expert Solution
Link Copied!

Question

1 Approved Answer

Can someone help me with this practice problem. I have no idea how to do it. Will you also break it down for me please.

Can someone help me with this practice problem. I have no idea how to do it. Will you also break it down for me please.

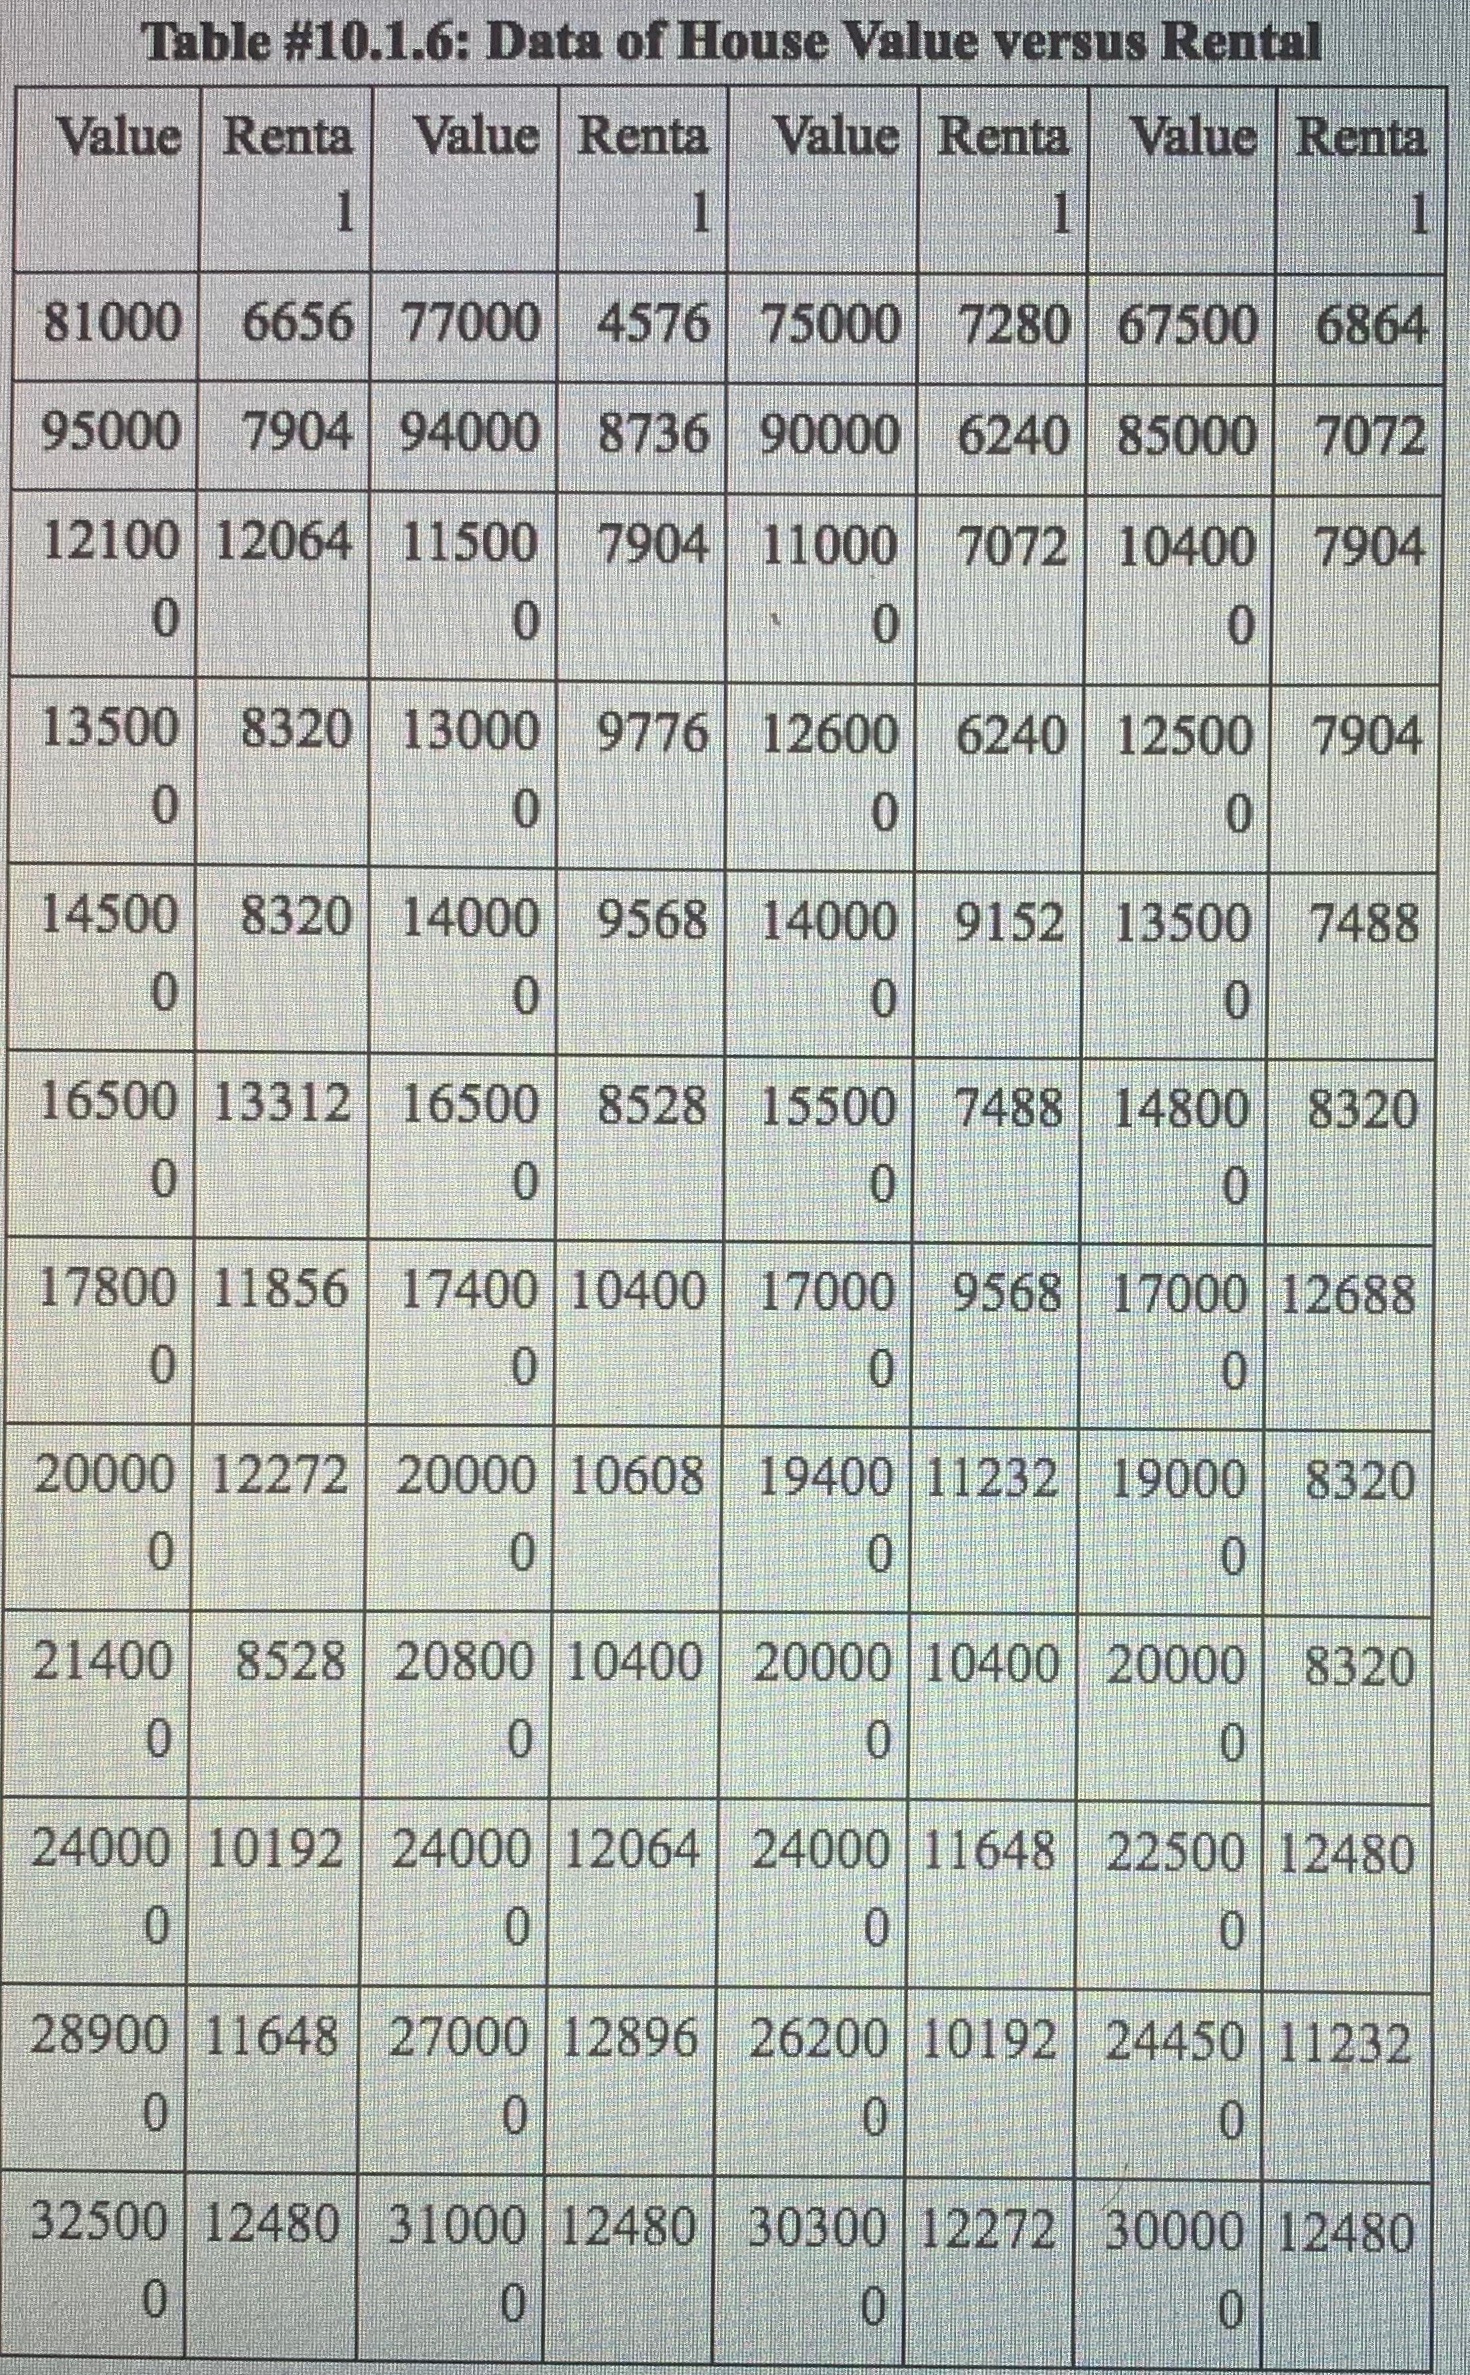
Table #10.1.6 contains the value of the house and the amount of rental income in a year that the house brings in ("Capital and rental," 2013).

Test at the 5% level for a positive correlation between house value and rental amount.

image text in transcribed
Table #10.1.6: Data of House Value versus Rental Value Renta Value Renta Value Renta Value Renta 81000 6656 77000 4576 75000 7280 67500 6864 95000 7904 94000 8736 90000 6240 85000 7072 12100 12064 11500 7904 11000 7072 10400 7904 0 0 0 0 13500 8320 13000 9776 12600 6240 12500 7904 0 0 0 0 14500 8320 14000 9568 14000 9152 13500 7488 0 0 0 0 16500 13312 16500 8528 15500 7488 14800 8320 0 0 0 0 17800 11856 17400 10400 17000 9568 17000 12688 0 0 0 0 20000 12272 20000 10608 19400 11232 19000 8320 0 0 0 0 21400 8528 20800 10400 20000 10400 20000 8320 0 0 0 0 24000 10192 24000 12064 24000 11648 22500 12480 0 0 0 0 28900 11648 27000 12896 26200 10192 24450 11232 0 0 0 0 32500 12480 31000 12480 30300 12272 30000 12480 0 0 0

Step by Step Solution

There are 3 Steps involved in it

Step: 1

blur-text-image

Get Instant Access to Expert-Tailored Solutions

See step-by-step solutions with expert insights and AI powered tools for academic success

Step: 2

blur-text-image

Step: 3

blur-text-image

Ace Your Homework with AI

Get the answers you need in no time with our AI-driven, step-by-step assistance

Get Started

Recommended Textbook for

Statistical Inference

Authors: George Casella, Roger L. Berger

2nd edition

0534243126, 978-0534243128

More Books

Students also viewed these Mathematics questions