

Question
Can someone help me with this R assignment? Here's the assignment: Here is my code: Here are my errors: I've had too much due this
Can someone help me with this R assignment?
Here's the assignment:
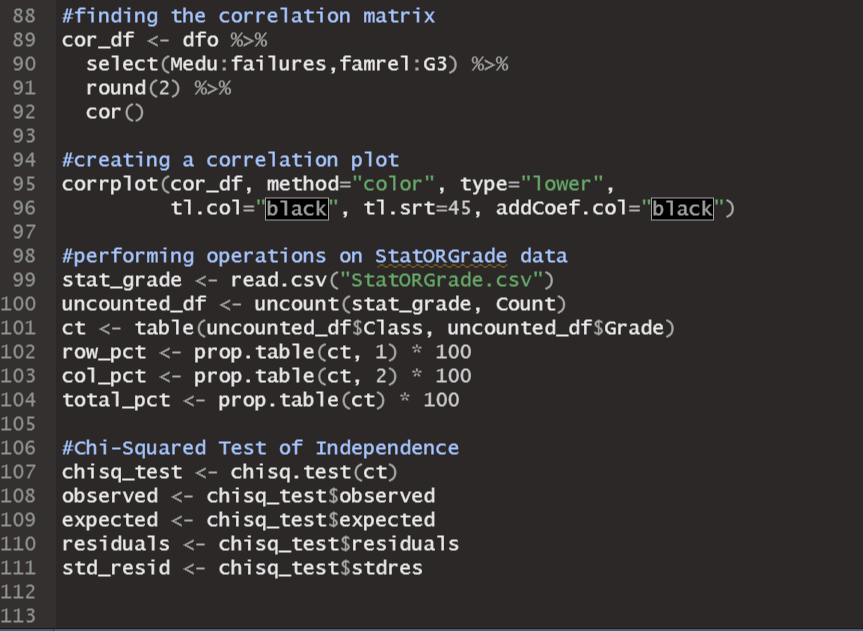
Here is my code:
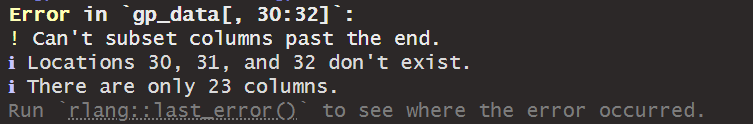
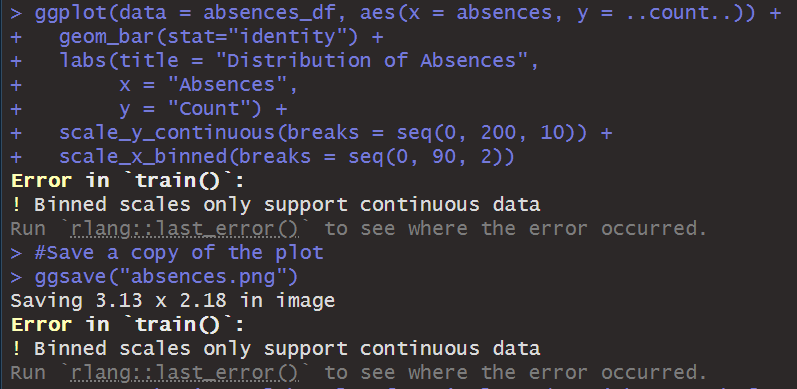
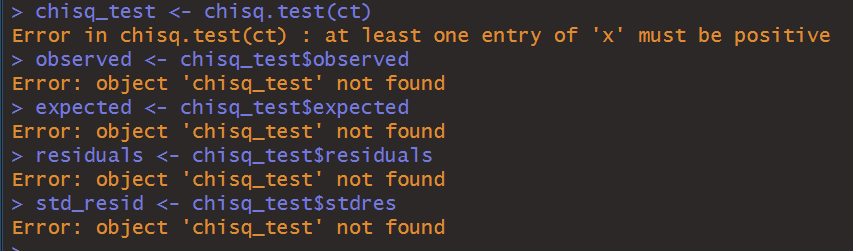
Here are my errors:


I've had too much due this week and I'm too drained to figure it out.
Feel free to upload answers for the question sections too :)
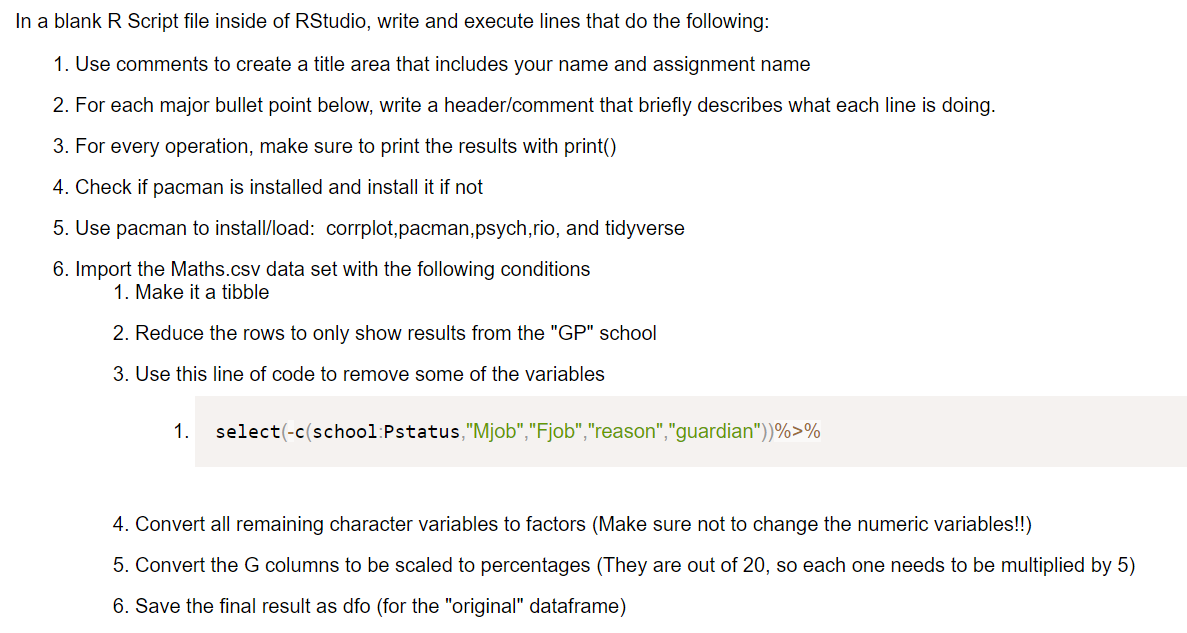
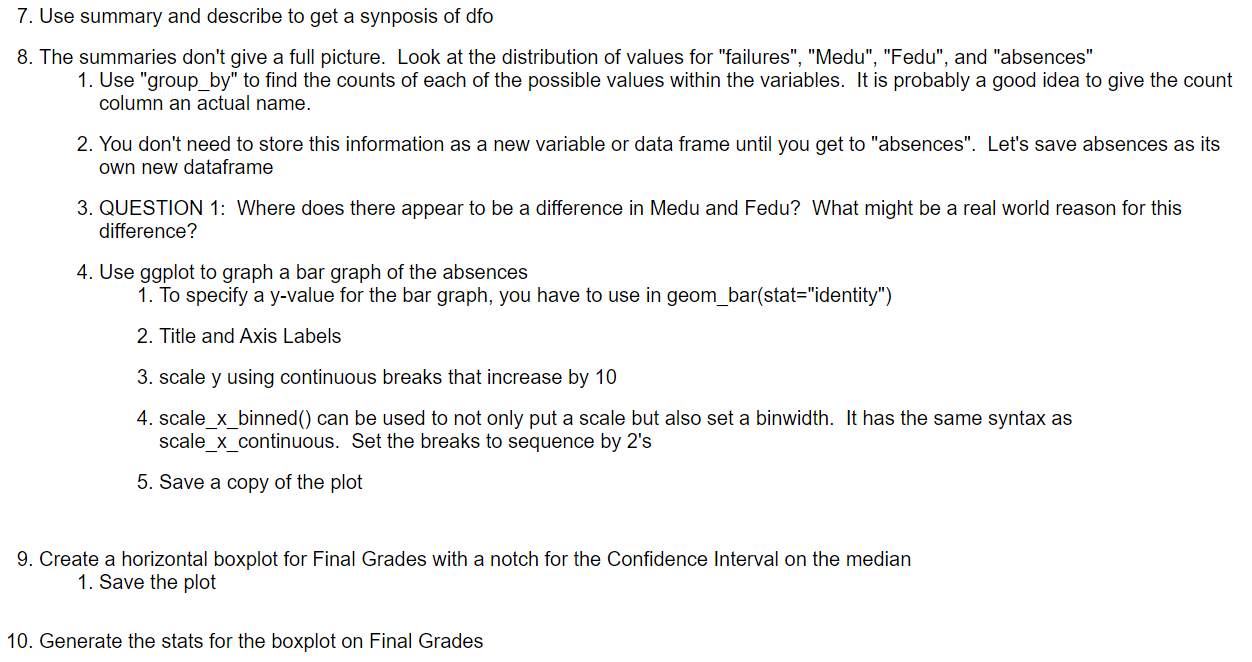
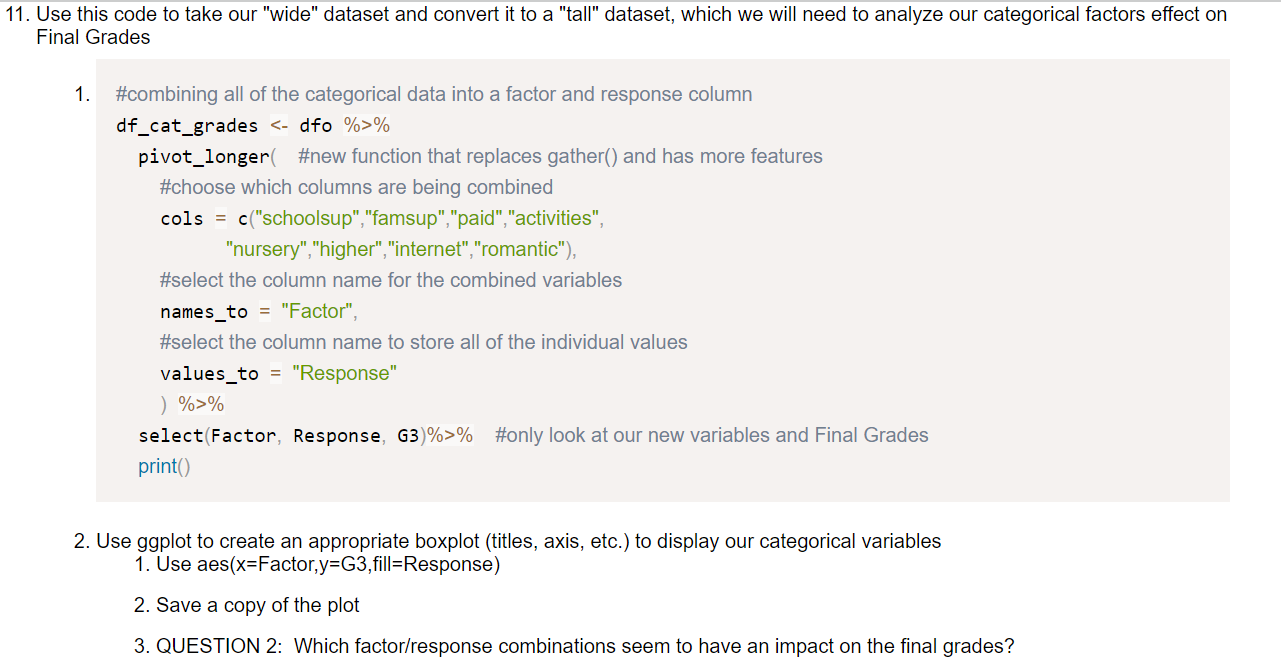
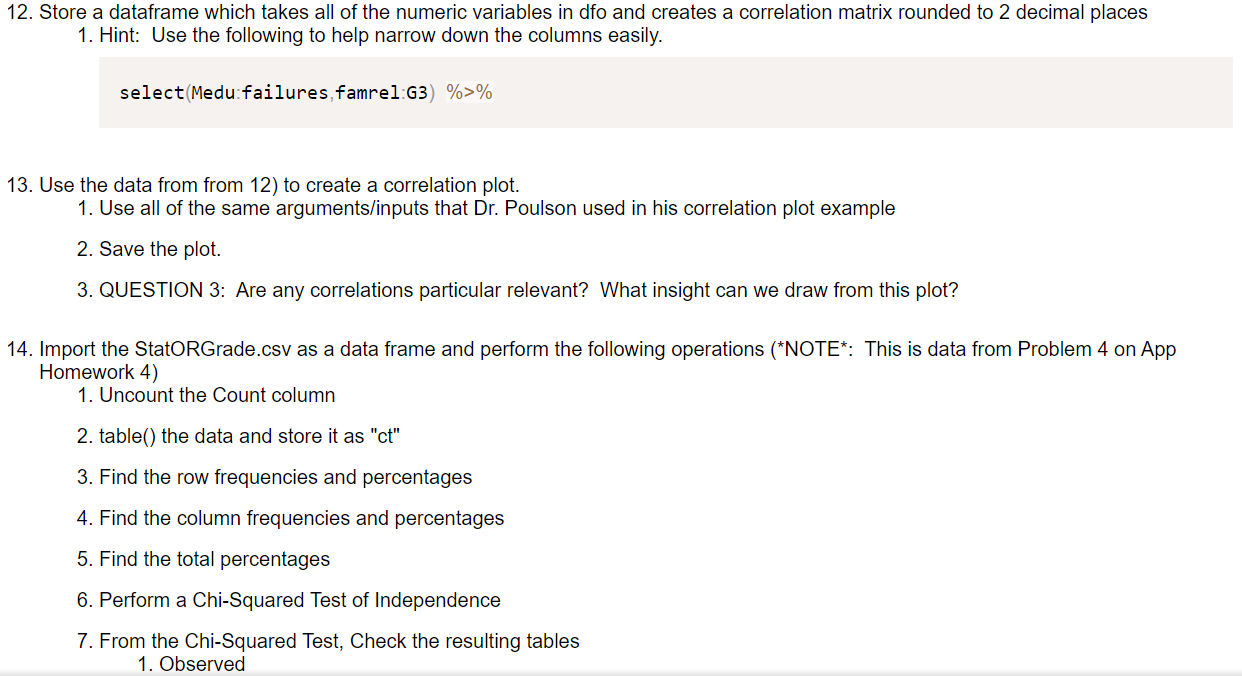
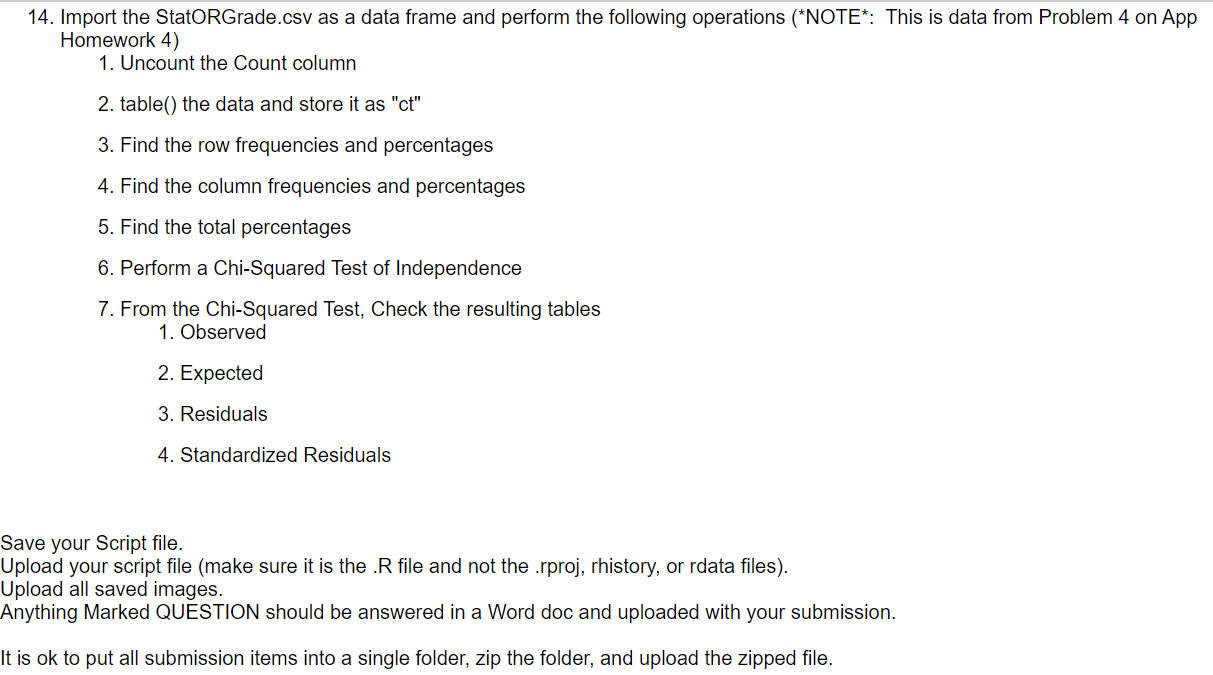
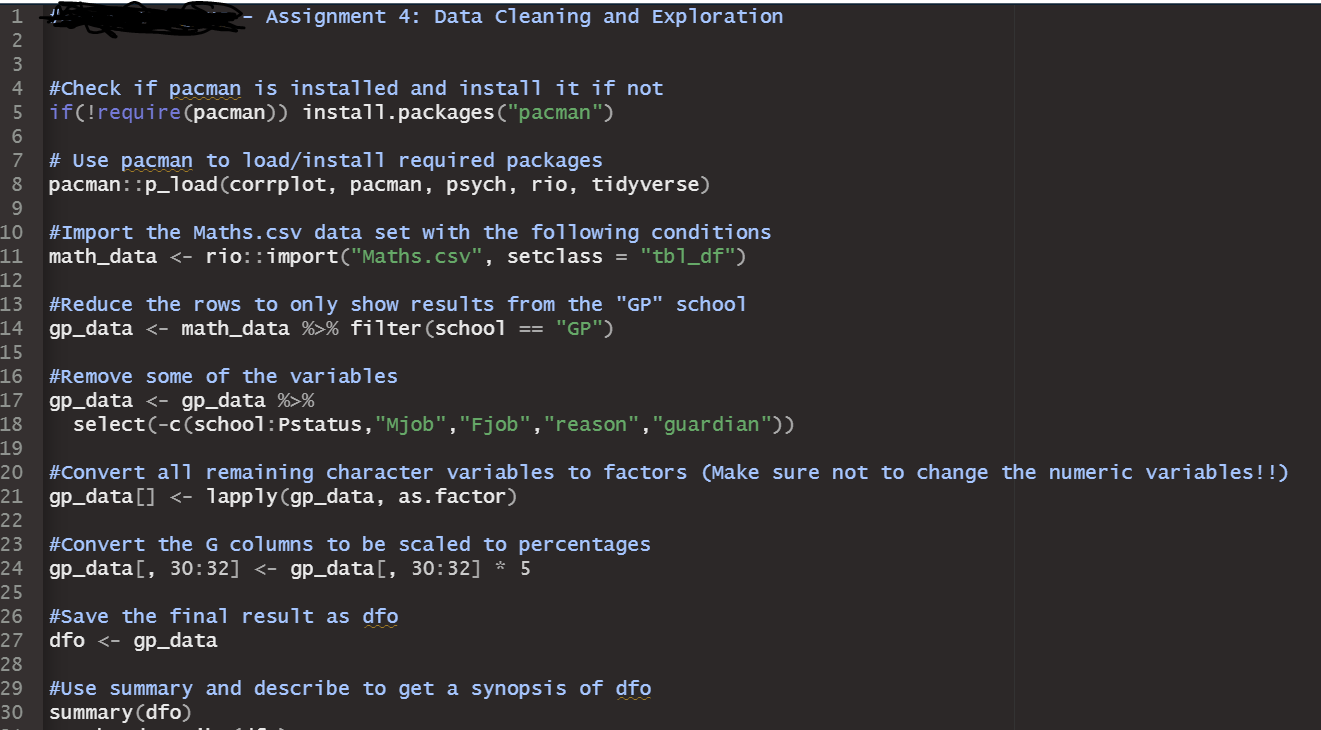
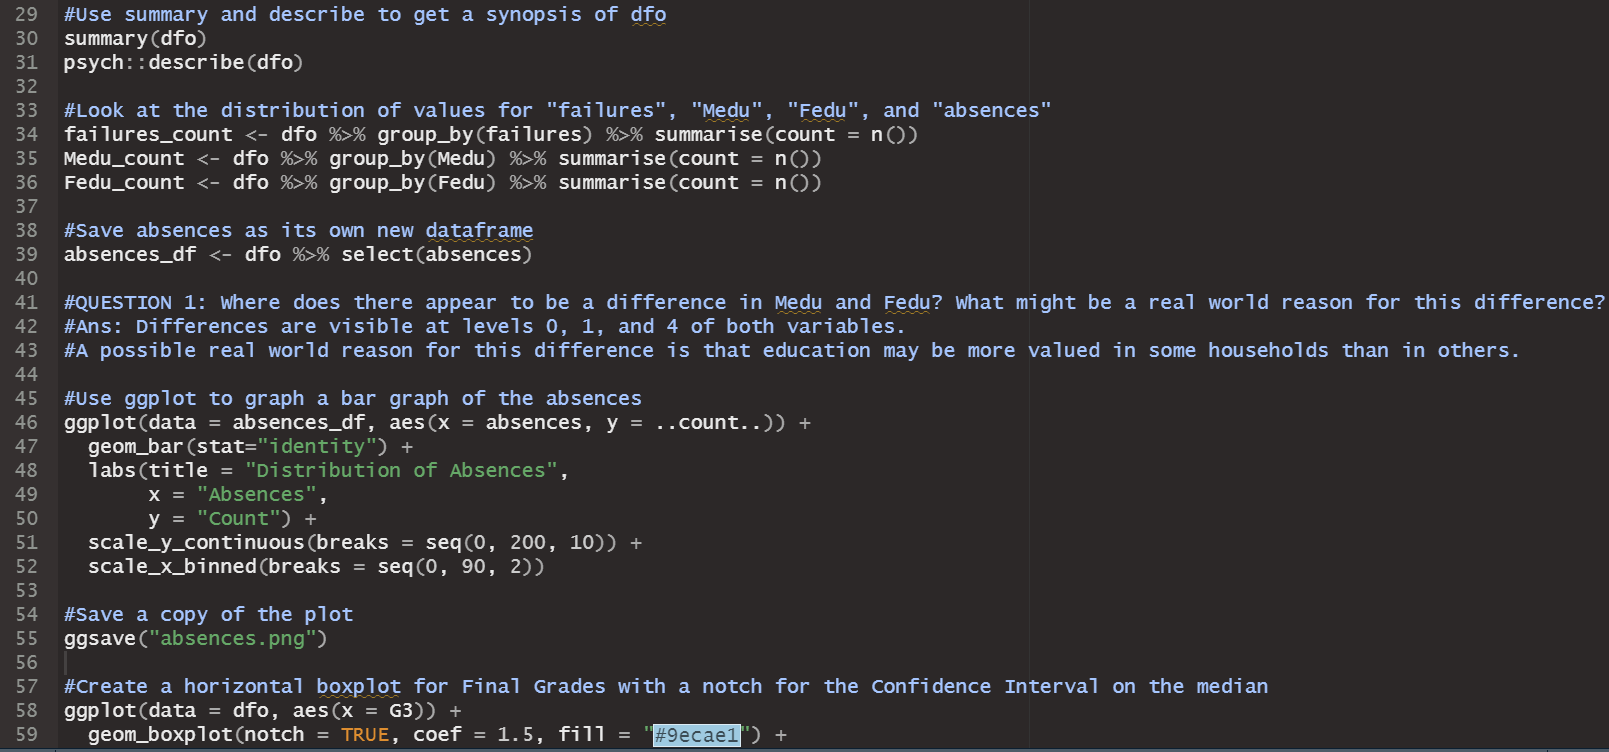
a blank R Script file inside of RStudio, write and execute lines that do the following: 1. Use comments to create a title area that includes your name and assignment name 2. For each major bullet point below, write a header/comment that briefly describes what each line is doing. 3. For every operation, make sure to print the results with print() 4. Check if pacman is installed and install it if not 5. Use pacman to install/load: corrplot,pacman,psych,rio, and tidyverse 6. Import the Maths.csv data set with the following conditions 1. Make it a tibble 2. Reduce the rows to only show results from the "GP" school 3. Use this line of code to remove some of the variables 1. select(-c(school:Pstatus,"Mjob","Fjob","reason","guardian"))\%>\% 4. Convert all remaining character variables to factors (Make sure not to change the numeric variables!!) 5. Convert the G columns to be scaled to percentages (They are out of 20 , so each one needs to be multiplied by 5) 6. Save the final result as dfo (for the "original" dataframe) 7. Use summary and describe to get a synposis of dfo 8. The summaries don't give a full picture. Look at the distribution of values for "failures", "Medu", "Fedu", and "absences" 1. Use "group_by" to find the counts of each of the possible values within the variables. It is probably a good idea to give the count column an actual name. 2. You don't need to store this information as a new variable or data frame until you get to "absences". Let's save absences as its own new dataframe 3. QUESTION 1: Where does there appear to be a difference in Medu and Fedu? What might be a real world reason for this difference? 4. Use ggplot to graph a bar graph of the absences 1. To specify a y-value for the bar graph, you have to use in geom_bar(stat="identity") 2. Title and Axis Labels 3. scale y using continuous breaks that increase by 10 4. scale_x_binned() can be used to not only put a scale but also set a binwidth. It has the same syntax as scale_x_continuous. Set the breaks to sequence by 2's 5. Save a copy of the plot 9. Create a horizontal boxplot for Final Grades with a notch for the Confidence Interval on the median 1. Save the plot 10. Generate the stats for the boxplot on Final Grades Use this code to take our "wide" dataset and convert it to a "tall" dataset, which we will need to analyze our categorical factors effect on Final Grades 1. \#combining all of the categorical data into a factor and response column df_cat_grades %>% pivot_longer ( \#new function that replaces gather() and has more features \#choose which columns are being combined cols = c("schoolsup","famsup","paid", "activities", "nursery","higher","internet","romantic"), \#select the column name for the combined variables names_to = "Factor", \#select the column name to store all of the individual values values_to = "Response" ) %>% select(Factor, Response, G3)\%>\% \#only look at our new variables and Final Grades print() 2. Use ggplot to create an appropriate boxplot (titles, axis, etc.) to display our categorical variables 1. Use aes (x= Factor, y=G3, fill = Response ) 2. Save a copy of the plot 3. QUESTION 2: Which factor/response combinations seem to have an impact on the final grades? 12. Store a dataframe which takes all of the numeric variables in dfo and creates a correlation matrix rounded to 2 decimal places 1. Hint: Use the following to help narrow down the columns easily. select(Medu:failures,famrel:G3)%>% 13. Use the data from from 12) to create a correlation plot. 1. Use all of the same arguments/inputs that Dr. Poulson used in his correlation plot example 2. Save the plot. 3. QUESTION 3: Are any correlations particular relevant? What insight can we draw from this plot? 14. Import the StatORGrade.csv as a data frame and perform the following operations ( NOTE This is data from Problem 4 on App Homework 4) 1. Uncount the Count column 2. table() the data and store it as "ct" 3. Find the row frequencies and percentages 4. Find the column frequencies and percentages 5. Find the total percentages 6. Perform a Chi-Squared Test of Independence 7. From the Chi-Squared Test, Check the resulting tables 1. Observed 14. Import the StatORGrade.csv as a data frame and perform the following operations (NOTE This is data from Problem 4 on App Homework 4) 1. Uncount the Count column 2. table() the data and store it as "ct" 3. Find the row frequencies and percentages 4. Find the column frequencies and percentages 5. Find the total percentages 6. Perform a Chi-Squared Test of Independence 7. From the Chi-Squared Test, Check the resulting tables 1. Observed 2. Expected 3. Residuals 4. Standardized Residuals Save your Script file. Jpload your script file (make sure it is the .R file and not the .rproj, rhistory, or rdata files). Jpload all saved images. Anything Marked QUESTION should be answered in a Word doc and uploaded with your submission. t is ok to put all submission items into a single folder, zip the folder, and upload the zipped file. Error in gp_data [,30:32]: ! Can't subset columns past the end. i Locations 30,31 , and 32 don't exist. i There are on 7y23 columns. Run ryang.:7ast error(). to see where the error occurred. Error in boxplot_stats(dfo\$G3) : could not find function "boxplot_stats" Error in Math.data.frame(7ist(Medu =c(5L,2L,2L,5L,4L,5L,3L,5L, : non-numeric-alike variable(s) in data frame: Medu, Fedu, trave7time, studytime, failures, famre1, freetime, goout, Da7c, wa7c, health, absences, G1, G2, G3 > chisq_test x ' must be positive > observed > expected > residuals > std_residStep by Step Solution
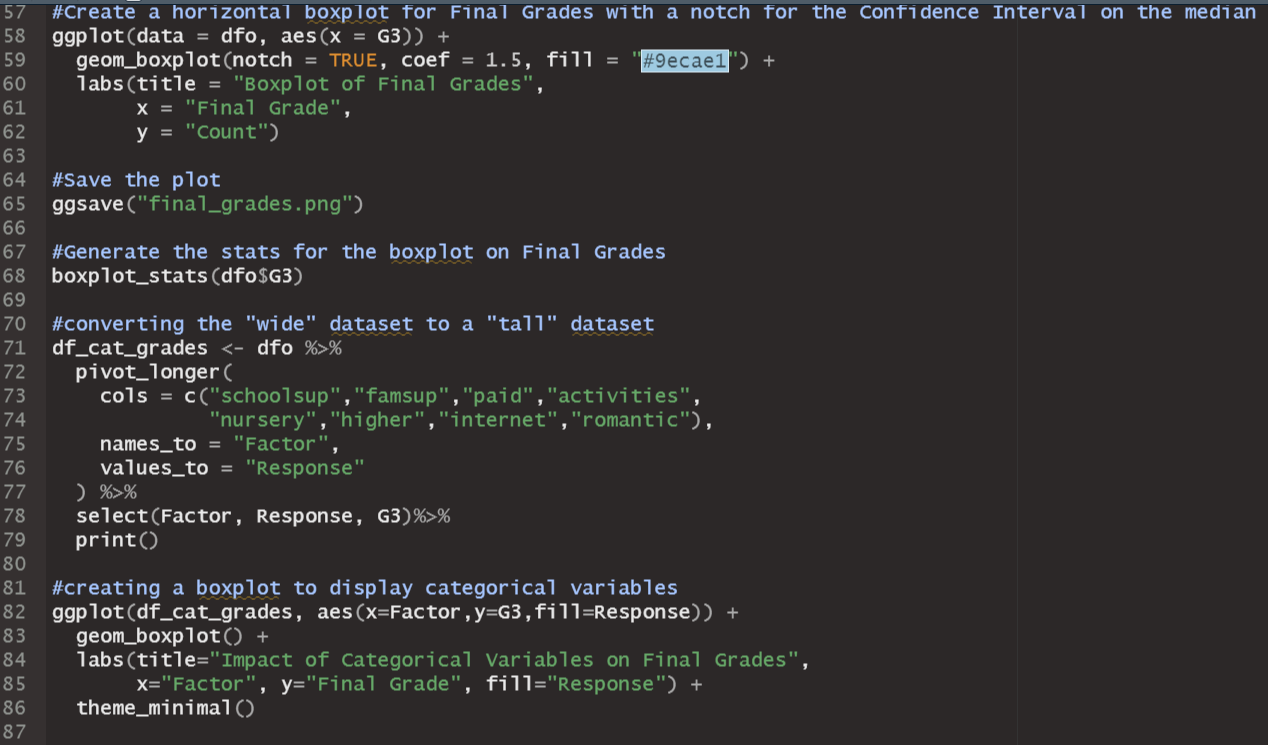
There are 3 Steps involved in it
Step: 1

Get Instant Access to Expert-Tailored Solutions
See step-by-step solutions with expert insights and AI powered tools for academic success
Step: 2

Step: 3
Ace Your Homework with AI
Get the answers you need in no time with our AI-driven, step-by-step assistance
Get Started
Machine Learning And Knowledge Discovery In Databases European Conference Ecml Pkdd 2015 Porto Portugal September 7 11 2015 Proceedings Part 2 Lnai 9285
Authors: Annalisa Appice ,Pedro Pereira Rodrigues ,Vitor Santos Costa ,Joao Gama ,Alipio Jorge ,Carlos Soares
1st Edition
3319235249, 978-3319235240