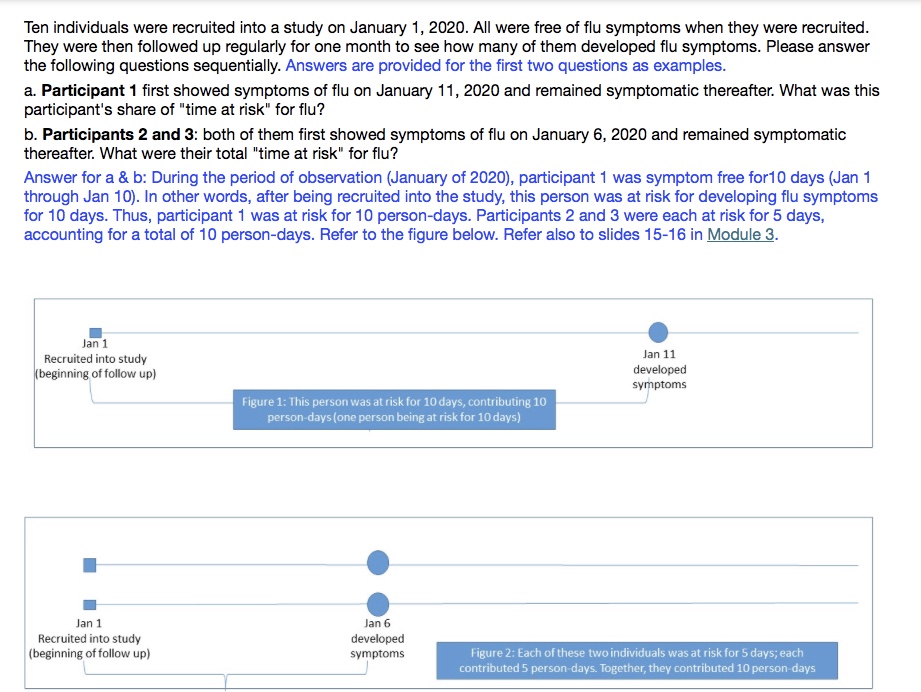
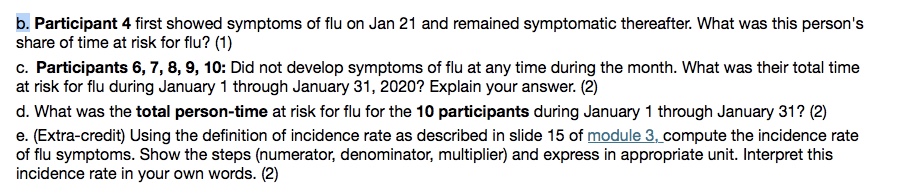
can someone help on this worksheet
Ten individuals were recruited into a study on January 1, 2020. All were free of flu symptoms when they were recruited. They were then followed up regularly for one month to see how many of them developed flu symptoms. Please answer the following questions sequentially. Answers are provided for the first two questions as examples. a. Participant 1 first showed symptoms of flu on January 11, 2020 and remained symptomatic thereafter. What was this participant's share of "time at risk" for flu? b. Participants 2 and 3: both of them first showed symptoms of flu on January 6, 2020 and remained symptomatic thereafter. What were their total "time at risk" for flu? Answer for a & b: During the period of observation (January of 2020), participant 1 was symptom free for10 days (Jan 1 through Jan 10). In other words, after being recruited into the study, this person was at risk for developing flu symptoms for 10 days. Thus, participant 1 was at risk for 10 person-days. Participants 2 and 3 were each at risk for 5 days, accounting for a total of 10 person-days. Refer to the figure below. Refer also to slides 15-16 in Module 3. Jan 1 Recruited into study Jan 11 (beginning of follow up) developed symptoms Figure 1: This person was at risk for 10 days, contributing 10 person-days (one person being at risk for 10 days) Jan 1 Jan 6 Recruited into study developed (beginning of follow up) symptoms Figure 2: Each of these two individuals was at risk for 5 days; each contributed 5 person-days. Together, they contributed 10 person-daysb. Participant 4 first showed symptoms of flu on Jan 21 and remained symptomatic thereafter. What was this person's share of time at risk for flu? (1) c. Participants 6, 7, 8, 9, 10: Did not develop symptoms of flu at any time during the month. What was their total time at risk for flu during January 1 through January 31, 2020? Explain your answer. (2) d. What was the total person-time at risk for flu for the 10 participants during January 1 through January 31? (2) e. (Extra-credit) Using the definition of incidence rate as described in slide 15 of module 3, compute the incidence rate of flu symptoms. Show the steps (numerator, denominator, multiplier) and express in appropriate unit. Interpret this incidence rate in your own words. (2)