Answered step by step
Verified Expert Solution
Question
1 Approved Answer
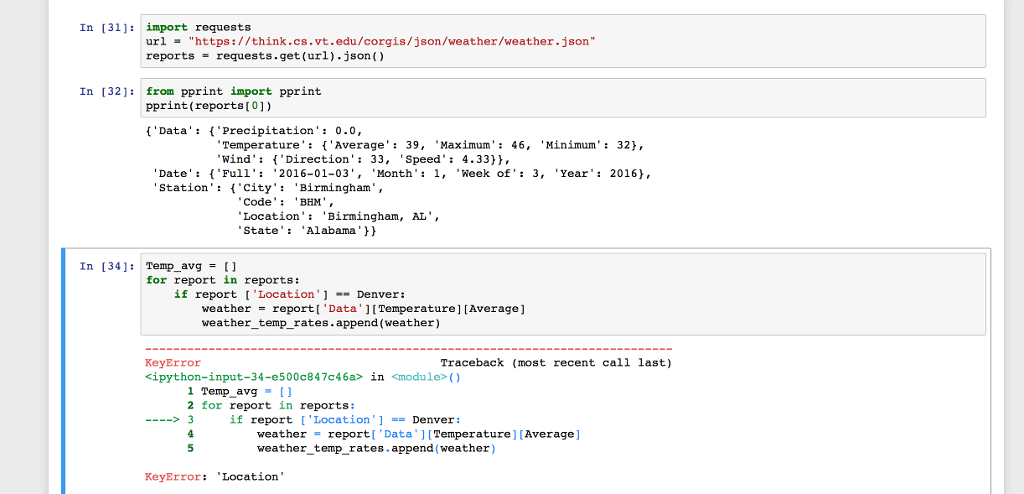
Can someone please help, I'm using Jupyter notebook (basically python) to try and use this dataset provided in the link below to create a histogram
Can someone please help, I'm using Jupyter notebook (basically python) to try and use this dataset provided in the link below to create a histogram and line graph for the precipitation. Please help me create the code to make a histrogram and line plot.
https://think.cs.vt.edu/corgis/json/weather/weather.html

Step by Step Solution
There are 3 Steps involved in it
Step: 1

Get Instant Access to Expert-Tailored Solutions
See step-by-step solutions with expert insights and AI powered tools for academic success
Step: 2

Step: 3

Ace Your Homework with AI
Get the answers you need in no time with our AI-driven, step-by-step assistance
Get Started


