Can someone please help me answer question 1,2 and 3 if possible. Please use Excel, thanks
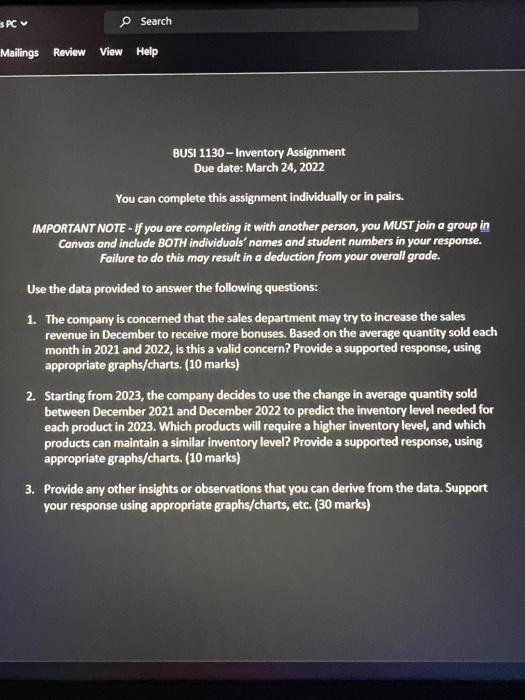
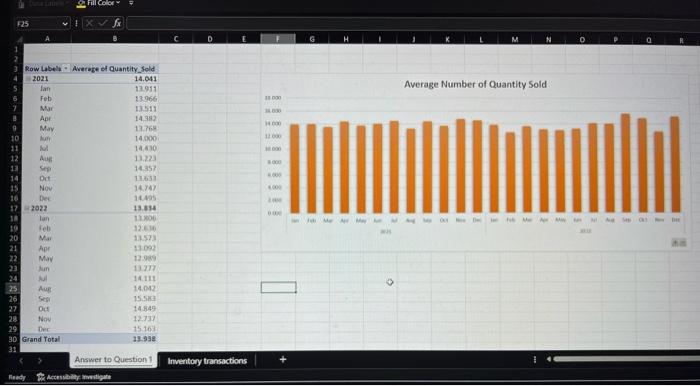
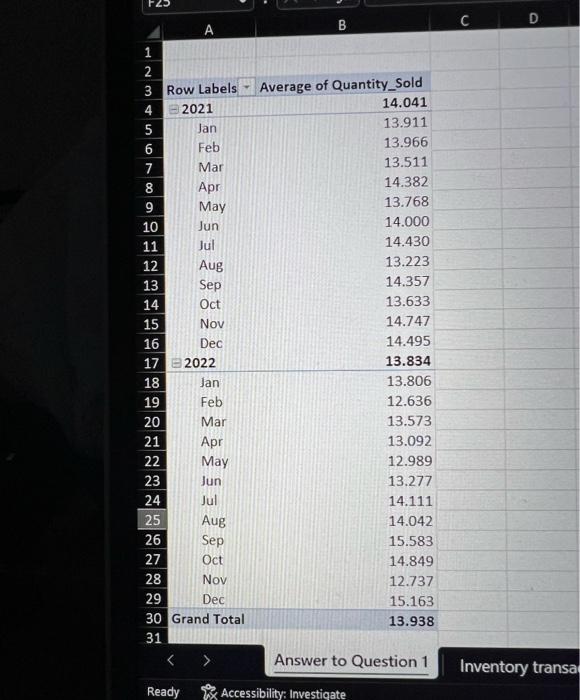
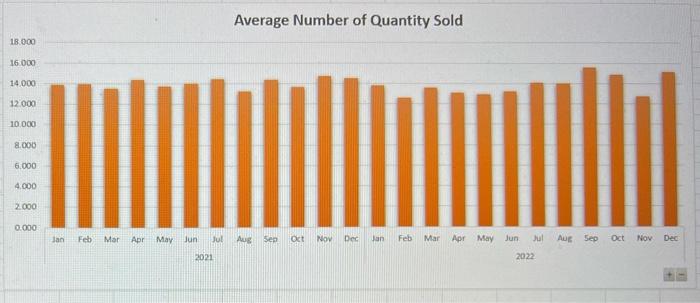
BUSI 1130 - Inventory Assignment Due date: March 24, 2022 You can complete this assignment individually or in pairs. MPORTANT NOTE - If you are completing it with another person, you MUST join a group in Canvas and include BOTH individuals' names and student numbers in your response. Failure to do this may result in a deduction from your overall grade. Use the data provided to answer the following questions: 1. The company is concerned that the sales department may try to increase the sales revenue in December to receive more bonuses. Based on the average quantity sold each month in 2021 and 2022, is this a valid concern? Provide a supported response, using appropriate graphs/charts. (10 marks) 2. Starting from 2023 , the company decides to use the change in average quantity sold between December 2021 and December 2022 to predict the inventory level needed for each product in 2023. Which products will require a higher inventory level, and which products can maintain a similar inventory level? Provide a supported response, using appropriate graphs/charts. (10 marks) 3. Provide any other insights or observations that you can derive from the data. Support your response using appropriate graphs/charts, etc. ( 30 marks) : Average Number of Quantity Sold (ion = h Alumban of n.umsis. C-1d a. BUSI 1130 - Inventory Assignment Due date: March 24, 2022 You can complete this assignment individually or in pairs. MPORTANT NOTE - If you are completing it with another person, you MUST join a group in Canvas and include BOTH individuals' names and student numbers in your response. Failure to do this may result in a deduction from your overall grade. Use the data provided to answer the following questions: 1. The company is concerned that the sales department may try to increase the sales revenue in December to receive more bonuses. Based on the average quantity sold each month in 2021 and 2022, is this a valid concern? Provide a supported response, using appropriate graphs/charts. (10 marks) 2. Starting from 2023 , the company decides to use the change in average quantity sold between December 2021 and December 2022 to predict the inventory level needed for each product in 2023. Which products will require a higher inventory level, and which products can maintain a similar inventory level? Provide a supported response, using appropriate graphs/charts. (10 marks) 3. Provide any other insights or observations that you can derive from the data. Support your response using appropriate graphs/charts, etc. ( 30 marks) : Average Number of Quantity Sold (ion = h Alumban of n.umsis. C-1d a


