Answered step by step
Verified Expert Solution
Question
1 Approved Answer
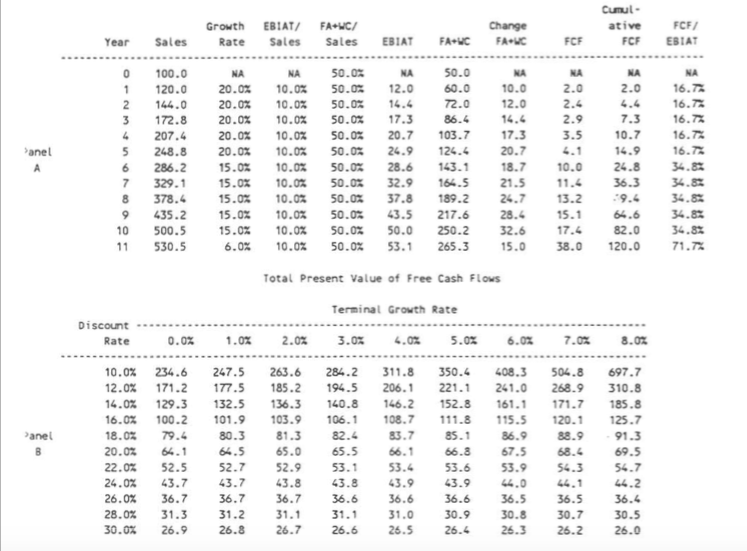
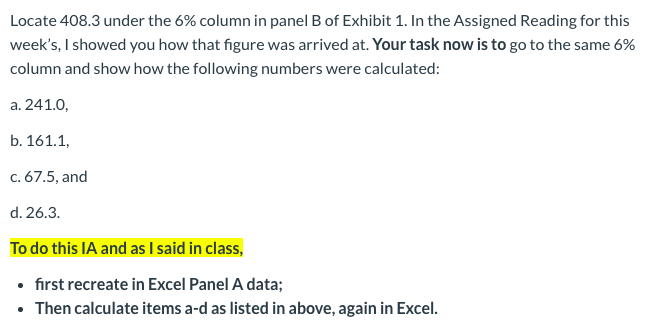
Can someone please help me to calculate how a-d was found. I need to know what numbers were used to find the answers a-d through


Can someone please help me to calculate how a-d was found. I need to know what numbers were used to find the answers a-d through the FCF method
Cumul EBIAT FA+WC Growth Change ative FCF/ FA C Sales Sales EBIAT FA+WC FCF FCF EBIAT Year Sales Rate 50.02 50.0 NA 100.0 NA NA NA NA NA NA 2.0 2.0 16.77 20.0% 10.0% 50.0% 12.0 60.0 10.0 1 120.0 50.0% 50.0% 72.0 12.0 2.4 16.7 2 144.0 20.0% 10.0% 14.4 4.4 17.3 7.3 16.7% 3 172.8 20.0% 10.0% 86.4 14.4 2.9 20.7 17.3 3.5 10.7 16.7 4 207.4 20.0% 10.0% 50.0% 103.7 anel 24.9 124.4 20.7 14.9 16.7% 5 248.8 20.0% 10.02 50.0% 4.1 24.8 28.6 143.1 18.7 10.0 34.8 6 286.2 15.0% 10.0% 50.0% 32.9 37.8 21.5 7 329.1 15.0% 10.0% 50.0% 164.5 36.3 34.8 11.4 13.2 34.8 8 378.4 15.0% 10.0% 50.0% 189.2 24.7 9.4 43.5 50.0 9 435.2 15.0% 10.0% 50.0% 217.6 28.4 15.1 64.6 34.82 250.2 17.4 82.0 34.82 10 500.5 15.0% 10.0% 50.0% 32.6 11 530.5 53.1 71.T 6.0% 10.0% 50.0% 265.3 15.0 38.0 120.0 Total Present Value of Free Cash Flows Terminal Growth Rate Discount 3.0% 4.0% 0.0% 1.0% 2.0% 5.0% 6.0% 7.0% 8.0% Rate 408.3 10.0% 234.6 247.5 263.6 284.2 311.8 350.4 504.8 697.7 12.0% 171.2 177.5 185.2 194.5 206.1 221.1 241.0 268.9 310.8 129.3 132.5 101.9 136.3 140.8 146.2 152.8 171.7 14.0% 161.1 185.8 16.0% 100.2 103.9 106.1 108.7 111.8 115.5 120.1 125.7 anel 18.02 79.4 80.3 81.3 82.4 83.7 85.1 86.9 88.9 91.3 65.0 20.0% 64.1 64.5 65.5 66.1 66.8 67.5 68.4 69.5 52.5 22.0% 52.7 52.9 53.1 53.4 53.6 53.9 54.3 54.7 24.0% 43.7 43.8 36.7 43.8 43.9 44.0 44.2 43.7 43.9 44.1 26.0% 36.7 36.7 36.6 36.6 36.6 36.5 36.5 36.4 28.0% 31.3 31.2 31.1 31.1 31.0 30.9 30.8 30.7 30.5 26.8 30.0% 26.9 26.7 26.5 26.3 26.6 26.4 26.2 26.0 Locate 408.3 under the 6% column in panel B of Exhibit 1. In the Assigned Reading for this week's, I showed you how that figure was arrived at. Your task now is to go to the same 6% column and show how the following numbers were calculated: a. 241.0 b. 161.1 c. 67.5, and d. 26.3. To do this IA and as I said in class, first recreate in Excel Panel A data; Then calculate items a-d as listed in above, again in Excel. Cumul EBIAT FA+WC Growth Change ative FCF/ FA C Sales Sales EBIAT FA+WC FCF FCF EBIAT Year Sales Rate 50.02 50.0 NA 100.0 NA NA NA NA NA NA 2.0 2.0 16.77 20.0% 10.0% 50.0% 12.0 60.0 10.0 1 120.0 50.0% 50.0% 72.0 12.0 2.4 16.7 2 144.0 20.0% 10.0% 14.4 4.4 17.3 7.3 16.7% 3 172.8 20.0% 10.0% 86.4 14.4 2.9 20.7 17.3 3.5 10.7 16.7 4 207.4 20.0% 10.0% 50.0% 103.7 anel 24.9 124.4 20.7 14.9 16.7% 5 248.8 20.0% 10.02 50.0% 4.1 24.8 28.6 143.1 18.7 10.0 34.8 6 286.2 15.0% 10.0% 50.0% 32.9 37.8 21.5 7 329.1 15.0% 10.0% 50.0% 164.5 36.3 34.8 11.4 13.2 34.8 8 378.4 15.0% 10.0% 50.0% 189.2 24.7 9.4 43.5 50.0 9 435.2 15.0% 10.0% 50.0% 217.6 28.4 15.1 64.6 34.82 250.2 17.4 82.0 34.82 10 500.5 15.0% 10.0% 50.0% 32.6 11 530.5 53.1 71.T 6.0% 10.0% 50.0% 265.3 15.0 38.0 120.0 Total Present Value of Free Cash Flows Terminal Growth Rate Discount 3.0% 4.0% 0.0% 1.0% 2.0% 5.0% 6.0% 7.0% 8.0% Rate 408.3 10.0% 234.6 247.5 263.6 284.2 311.8 350.4 504.8 697.7 12.0% 171.2 177.5 185.2 194.5 206.1 221.1 241.0 268.9 310.8 129.3 132.5 101.9 136.3 140.8 146.2 152.8 171.7 14.0% 161.1 185.8 16.0% 100.2 103.9 106.1 108.7 111.8 115.5 120.1 125.7 anel 18.02 79.4 80.3 81.3 82.4 83.7 85.1 86.9 88.9 91.3 65.0 20.0% 64.1 64.5 65.5 66.1 66.8 67.5 68.4 69.5 52.5 22.0% 52.7 52.9 53.1 53.4 53.6 53.9 54.3 54.7 24.0% 43.7 43.8 36.7 43.8 43.9 44.0 44.2 43.7 43.9 44.1 26.0% 36.7 36.7 36.6 36.6 36.6 36.5 36.5 36.4 28.0% 31.3 31.2 31.1 31.1 31.0 30.9 30.8 30.7 30.5 26.8 30.0% 26.9 26.7 26.5 26.3 26.6 26.4 26.2 26.0 Locate 408.3 under the 6% column in panel B of Exhibit 1. In the Assigned Reading for this week's, I showed you how that figure was arrived at. Your task now is to go to the same 6% column and show how the following numbers were calculated: a. 241.0 b. 161.1 c. 67.5, and d. 26.3. To do this IA and as I said in class, first recreate in Excel Panel A data; Then calculate items a-d as listed in above, again in ExcelStep by Step Solution
There are 3 Steps involved in it
Step: 1

Get Instant Access to Expert-Tailored Solutions
See step-by-step solutions with expert insights and AI powered tools for academic success
Step: 2

Step: 3

Ace Your Homework with AI
Get the answers you need in no time with our AI-driven, step-by-step assistance
Get Started


