Can someone please help me with my Excel Accounting Project? I am confused as to where and how to start. Thank you in advance.
Your company is Amedisys Inc. Ticker AMED
Using data from the company you have been assigned for your term project prepare a horizontal analysis for the most current two years; a 10 year trend analysis (10 shorter if your company is younger) and vertical analysis for the two most current years for both the income statement and balance sheet. Graph the results. For the trend analysis you should include these major categories: Sales or earnings, COGS, gross profit, Operating expenses, sales expenses, net income. Balance sheet should include: Total current assets, total long term assets, current liabilities, total long term liabilities, total liabilities, and stockholders equity. Cash value statement for the last 3 years.
Information gathered so far: From my understanding, we take the numbers presented and create/output our own to be able to make a horizontal and vertical analysis.
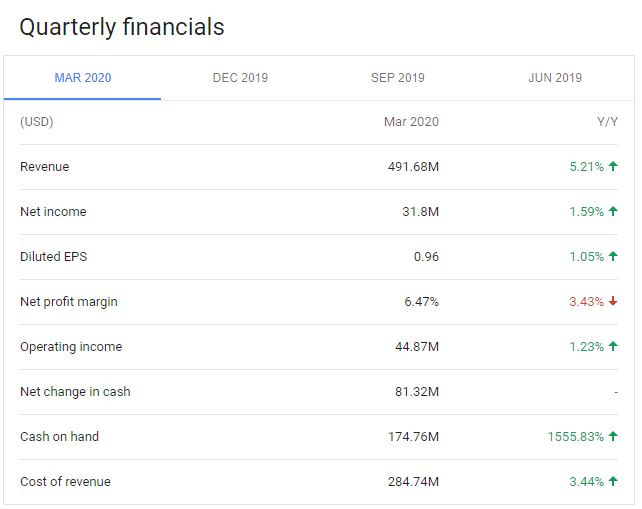
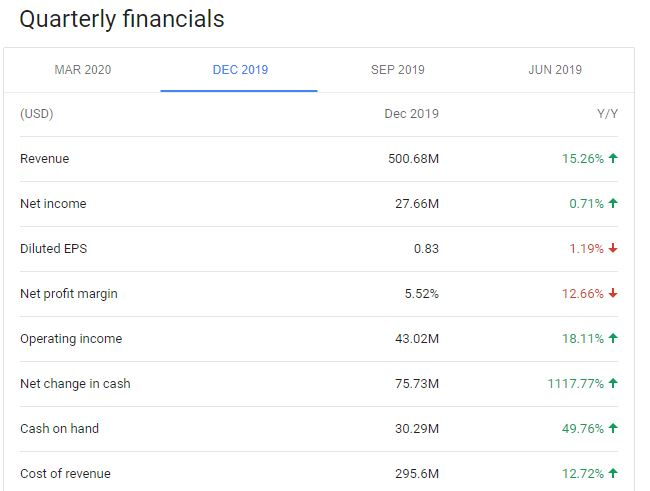
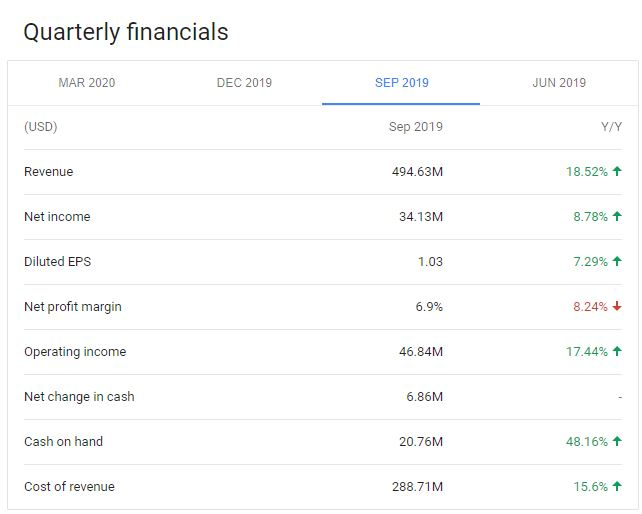
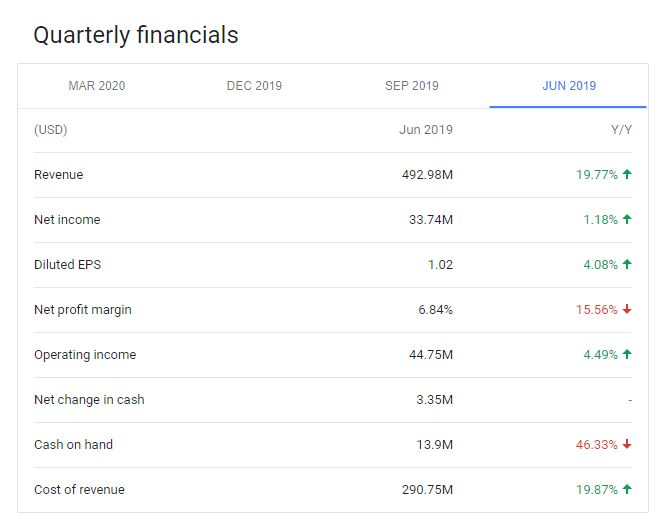
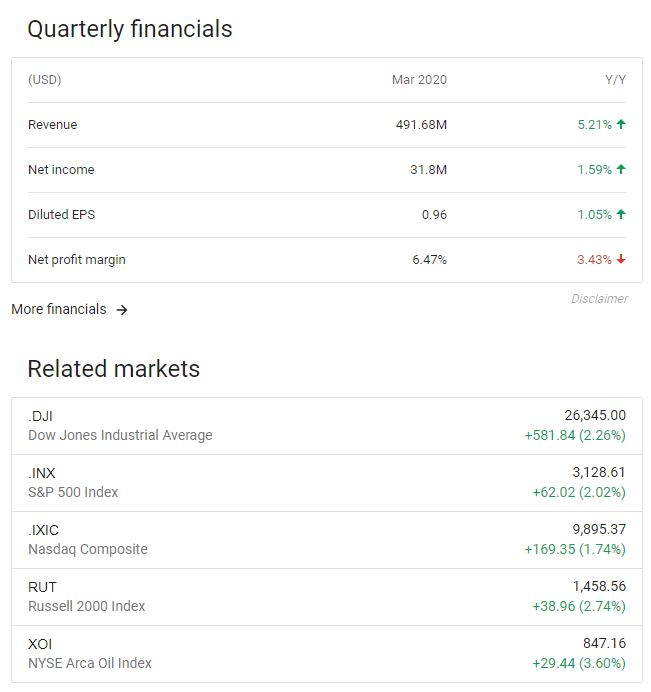
Quarterly financials MAR 2020 DEC 2019 SEP 2019 JUN 2019 (USD) Mar 2020 Y/Y Revenue 491.68M 5.21% 1 Net income 31.8M 1.59% + Diluted EPS 0.96 1.05% 1 Net profit margin 6.47% 3.43% + Operating income 44.87M 1.23% Net change in cash 81.32M Cash on hand 174.76M 1555.83% 1 Cost of revenue 284.74M 3.44% 1 Quarterly financials MAR 2020 DEC 2019 SEP 2019 JUN 2019 (USD) Dec 2019 Y/Y Revenue 500.68M 15.26% 1 Net income 27.66M 0.71% + Diluted EPS 0.83 1.19% + Net profit margin 5.52% 12.66% + Operating income 43.02M 18.11% Net change in cash 75.73M 1117.77% + Cash on hand 30.29M 49.76% + Cost of revenue 295.6M 12.72% + Quarterly financials MAR 2020 DEC 2019 SEP 2019 JUN 2019 (USD) Sep 2019 Y/Y Revenue 494.63M 18.52% 1 Net income 34.13M 8.78% + Diluted EPS 1.03 7.29% 1 Net profit margin 6.9% 8.24% + Operating income 46.84M 17.44% 1 Net change in cash 6.86M Cash on hand 20.76M 48.16% 1 Cost of revenue 288.71M 15.6% + Quarterly financials MAR 2020 DEC 2019 SEP 2019 JUN 2019 (USD) Jun 2019 Y/Y Revenue 492.98M 19.77% + Net income 33.74M 1.18% + Diluted EPS 1.02 4.08% + Net profit margin 6.84% 15.56% + Operating income 44.75M 4.49% + Net change in cash 3.35M Cash on hand 13.9M 46.33% + Cost of revenue 290.75M 19.87% 1 Quarterly financials (USD) Mar 2020 Y/Y Revenue 491.68M 5.21% Net income 31.8M 1.59% + Diluted EPS 0.96 1.05% 1 Net profit margin 6.47% 3.43% Disclaimer More financials Related markets DJI Dow Jones Industrial Average 26,345.00 +581.84 (2.26%) INX S&P 500 Index 3,128.61 +62.02 (2.02%) IXIC Nasdaq Composite 9,895.37 +169.35 (1.74%) RUT Russell 2000 Index 1,458.56 +38.96 (2.74%) NYSE Arca Oil Index 84 +29.44 (3.60%) Quarterly financials MAR 2020 DEC 2019 SEP 2019 JUN 2019 (USD) Mar 2020 Y/Y Revenue 491.68M 5.21% 1 Net income 31.8M 1.59% + Diluted EPS 0.96 1.05% 1 Net profit margin 6.47% 3.43% + Operating income 44.87M 1.23% Net change in cash 81.32M Cash on hand 174.76M 1555.83% 1 Cost of revenue 284.74M 3.44% 1 Quarterly financials MAR 2020 DEC 2019 SEP 2019 JUN 2019 (USD) Dec 2019 Y/Y Revenue 500.68M 15.26% 1 Net income 27.66M 0.71% + Diluted EPS 0.83 1.19% + Net profit margin 5.52% 12.66% + Operating income 43.02M 18.11% Net change in cash 75.73M 1117.77% + Cash on hand 30.29M 49.76% + Cost of revenue 295.6M 12.72% + Quarterly financials MAR 2020 DEC 2019 SEP 2019 JUN 2019 (USD) Sep 2019 Y/Y Revenue 494.63M 18.52% 1 Net income 34.13M 8.78% + Diluted EPS 1.03 7.29% 1 Net profit margin 6.9% 8.24% + Operating income 46.84M 17.44% 1 Net change in cash 6.86M Cash on hand 20.76M 48.16% 1 Cost of revenue 288.71M 15.6% + Quarterly financials MAR 2020 DEC 2019 SEP 2019 JUN 2019 (USD) Jun 2019 Y/Y Revenue 492.98M 19.77% + Net income 33.74M 1.18% + Diluted EPS 1.02 4.08% + Net profit margin 6.84% 15.56% + Operating income 44.75M 4.49% + Net change in cash 3.35M Cash on hand 13.9M 46.33% + Cost of revenue 290.75M 19.87% 1 Quarterly financials (USD) Mar 2020 Y/Y Revenue 491.68M 5.21% Net income 31.8M 1.59% + Diluted EPS 0.96 1.05% 1 Net profit margin 6.47% 3.43% Disclaimer More financials Related markets DJI Dow Jones Industrial Average 26,345.00 +581.84 (2.26%) INX S&P 500 Index 3,128.61 +62.02 (2.02%) IXIC Nasdaq Composite 9,895.37 +169.35 (1.74%) RUT Russell 2000 Index 1,458.56 +38.96 (2.74%) NYSE Arca Oil Index 84 +29.44 (3.60%)