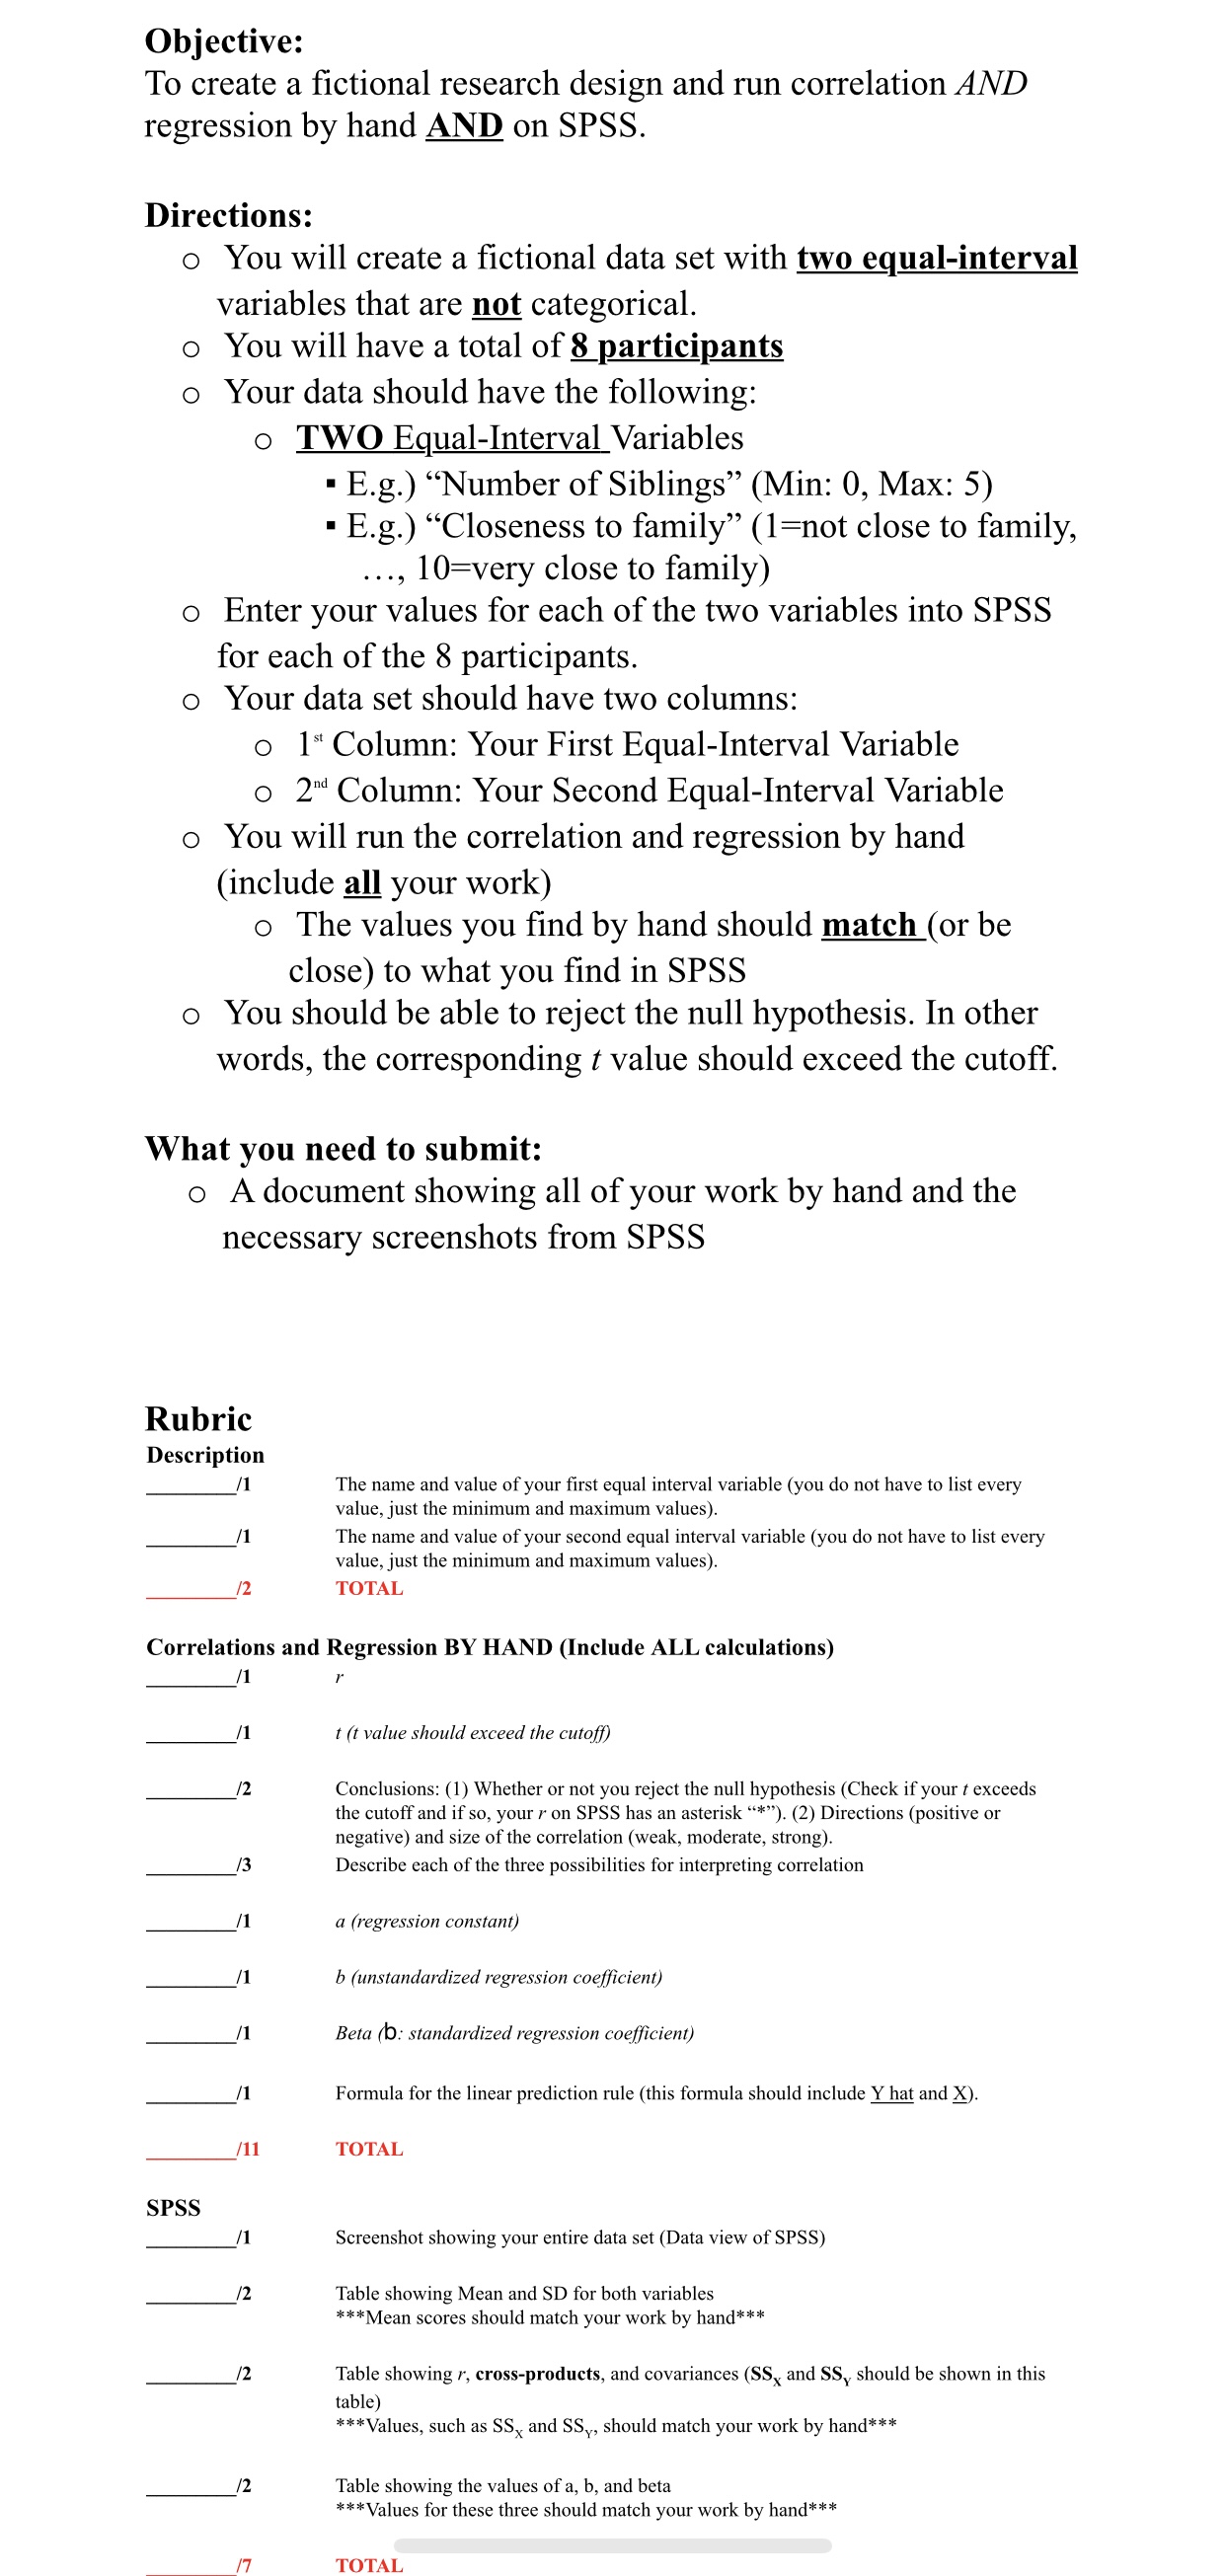
can someone please help me with this? I need help doing a fictional research design and run correlation and regression by hand AND SPSS.
Objective: To create a ctional research design and run correlation AND regression by hand AND on SPSS. Directions: 0 You will create a ctional data set with two equal-interval variables that are n_ot categorical. 0 You will have a total of iparticim 0 Your data should have the following: 0 TWO Equal-Interval Variables - E.g.) \"Number of Siblings\" (Min: 0, Max: 5) - E.g.) \"Closeness to family\" (1=not close to family, ..., 10=very close to family) 0 Enter your values for each of the two variables into SPSS for each of the 8 participants. 0 Your data set should have two columns: 0 1\" Column: Your First Equal-Interval Variable o 2"" Column: Your Second Equal-Interval Variable 0 You will run the correlation and regression by hand (include a_ll your work) 0 The values you nd by hand should match (or be close) to what you nd in SPSS 0 You should be able to reject the null hypothesis. In other words, the corresponding tvalue should exceed the cutoff. What you need to submit: o A document showing all of your work by hand and the necessary screenshots from SPSS Rubric Description I] The name and value of your first equal interval variable (you do not have to list every value, just the minimum and maximum values). [1 The name and value of your second equal interval variable (you do not have to list every value, just the minimum and maximum values). /2 TOTAL Correlations and Regression BY HAND (Include ALL calculations) f] r [1 t (t value should exceed the catty]? [2 Conclusions: (1) Whether or not you reject the null hypothesis (Check if your texceeds the cutoff and if so, your r on SPSS has an asterisk "*")4 (2) Directions (positive or negative) and size of the correlation (weak, moderate, strong) [3 Describe each of the three possibilities for interpreting correlation [1 a (regression constant) /1 b (unstandardized regression we'icient) fl Beta ([3 standardized regression coefcient) {'1 Formula for the linear prediction rule (this formula should include m and 3). fl 1 TOTAL SPSS ['1 Screenshot showing your entire data set (Data View of SPSS) [2 Table showing Mean and SD for both variables ***Mean scores should match your work by hand*** ['2 Table showing r, cross-products, and covariances (SSx and SSY should be shown in this table) "*Values, such as SSX and 38'\" should match your work by hand"\" [2 Table showing the values of a, b, and beta ***Values for these three should match your work by hand*** / 7 TOTAL


