Answered step by step
Verified Expert Solution
Question
1 Approved Answer
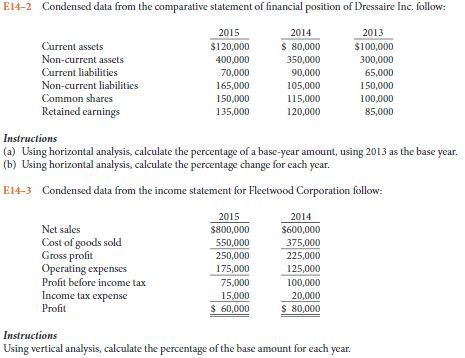
Can someone please help with both questions E14-2 & E14-3 shown below? E14-2 Condensed data from the comparative statement of financial postion of Dressaire Inc.

Can someone please help with both questions E14-2 & E14-3 shown below?
E14-2 Condensed data from the comparative statement of financial postion of Dressaire Inc. follow: 2014 S 80,000 350,000 90,000 105,000 115,000 120,000 2015 2013 Current assets Non-current assets Current liabilities Non-current liabilities Common shares Retained earnings $120,000 400,000 70,000 165,000 150,000 135,000 $100,000 300,000 65,000 150,000 100,000 85,000 (a) Using horizontal analysis, calculate the percentage of a base-year amount, using 2013 as the base year. (b) Using horizontal analysis, calculate the percentage change for each year. E14-3 Condensed data from the income statement for Fleetwood Corporation follow: Net sales Cost of goods sold Gross profit Operating expenses Profit before income tax Income tax expense Profit 2015 800,000 550,000 250,000 75,000 75,000 15,000 60,000 2014 $600,000 375,000 225,000 125,000 100,000 20,000 S80,000 Using vertical analysis, calculate the percentage of the base amount for each yearStep by Step Solution
There are 3 Steps involved in it
Step: 1

Get Instant Access to Expert-Tailored Solutions
See step-by-step solutions with expert insights and AI powered tools for academic success
Step: 2

Step: 3

Ace Your Homework with AI
Get the answers you need in no time with our AI-driven, step-by-step assistance
Get Started


