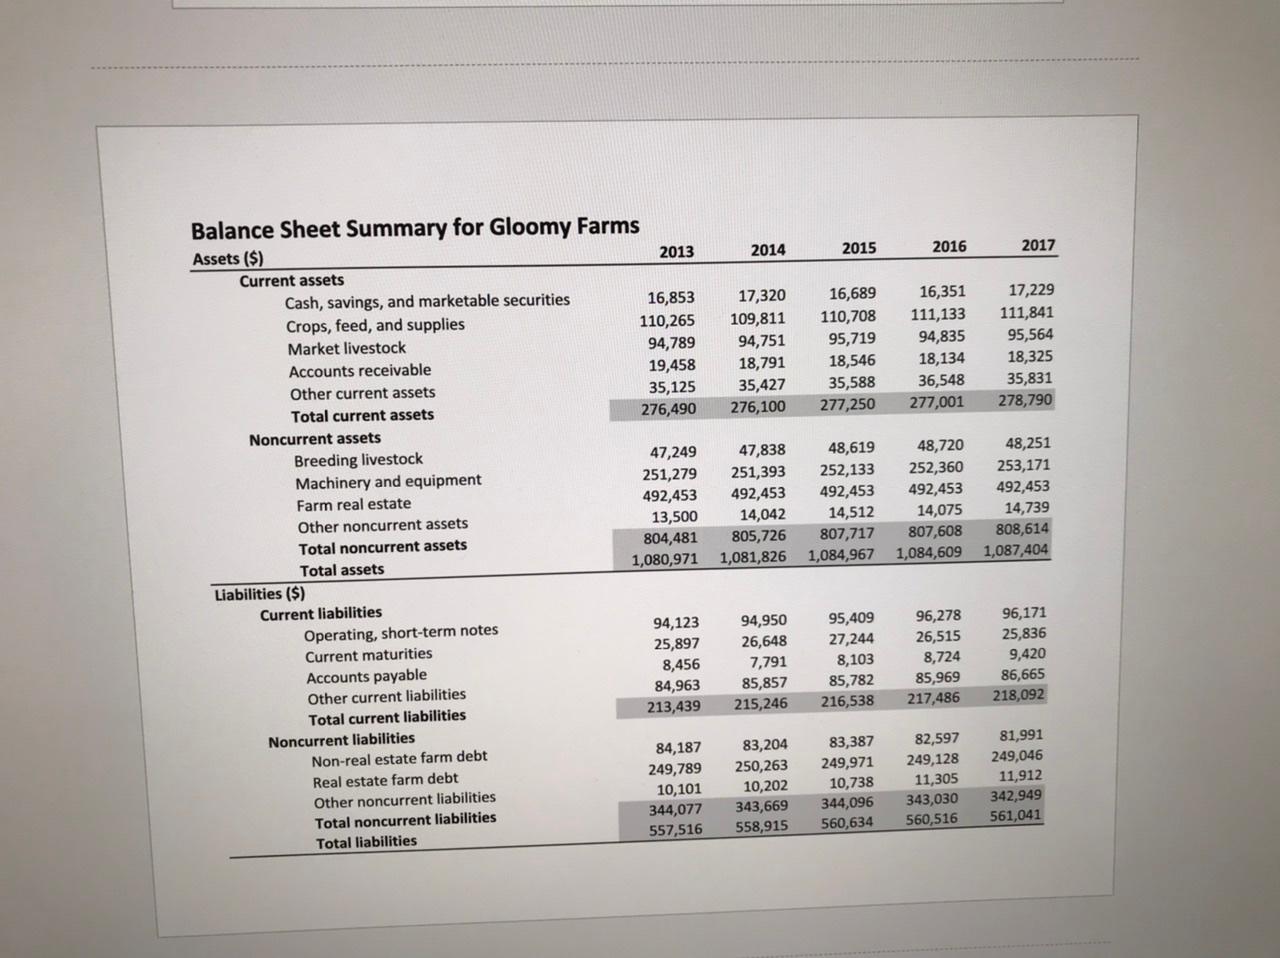
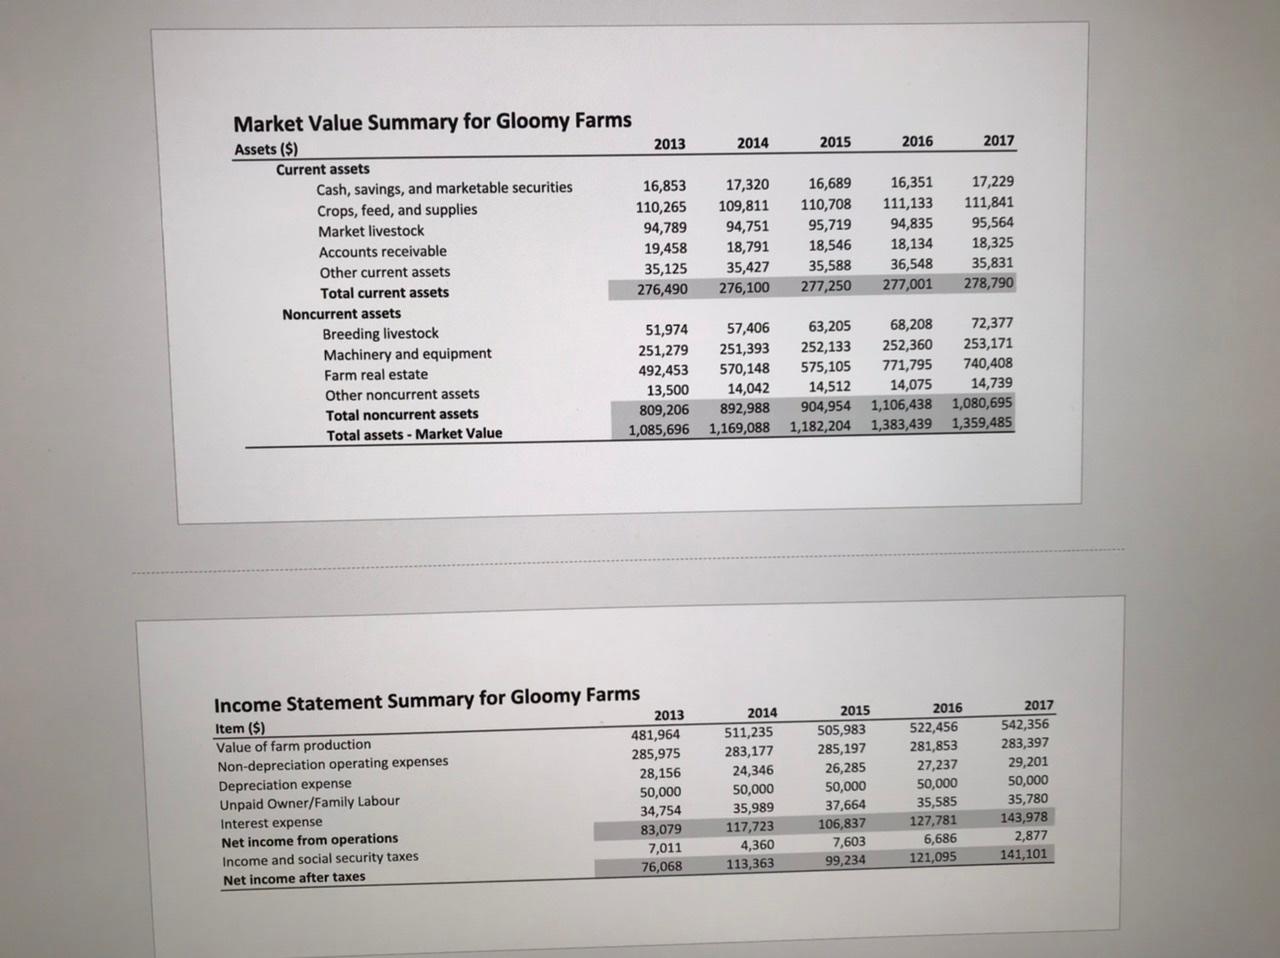
Can someone please help with these questions?
1. is Gloomy farms able to cover ALL of its debts if the business is sold in 2017? Demonstrate one ratio or measure to support your answer and explain why it supports your answer.
2. GRAPH owners equity AND net worth for Gloomy Farms over the 2013 to 2017 period. What kind of analysis is this an example of?
3. calculate the ROA for each year
4 calculate Capital Turnover ratio for each year. Is this ration trending upward or downward? Suggest why this trend is happening.
ROA=(Net income + interest paid-unpaid labour)/total assets
Capital Turnover=Value of Production/total assets


2014 2015 2016 2017 17,320 109,811 94,751 18,791 35,427 276,100 16,689 110,708 95,719 18,546 35,588 277,250 16,351 111,133 94,835 18,134 17,229 111,841 95,564 18,325 35,831 278,790 36,548 277,001 Balance Sheet Summary for Gloomy Farms Assets ($) 2013 Current assets Cash, savings, and marketable securities 16,853 Crops, feed, and supplies 110,265 Market livestock 94,789 Accounts receivable 19,458 Other current assets 35,125 Total current assets 276,490 Noncurrent assets Breeding livestock 47,249 Machinery and equipment 251,279 Farm real estate 492,453 Other noncurrent assets 13,500 Total noncurrent assets 804,481 Total assets 1,080,971 Liabilities ($) Current liabilities Operating, short-term notes 94,123 Current maturities 25,897 Accounts payable 8,456 Other current liabilities 84,963 Total current liabilities 213,439 Noncurrent liabilities Non-real estate farm debt 84,187 Real estate farm debt 249,789 Other noncurrent liabilities 10,101 Total noncurrent liabilities 344,077 Total liabilities 557,516 47,838 251,393 492,453 14,042 805,726 1,081,826 48,619 252,133 492,453 14,512 807,717 1,084,967 48,720 252,360 492,453 14,075 807,608 1,084,609 48,251 253,171 492,453 14,739 808,614 1,087,404 94,950 26,648 7,791 85,857 215,246 95,409 27,244 8,103 85,782 216,538 96,278 26,515 8,724 85,969 217,486 96,171 25,836 9,420 86,665 218,092 83,204 250,263 10,202 343,669 558,915 83,387 249,971 10,738 344,096 560,634 82,597 249,128 11,305 343,030 560,516 81,991 249,046 11,912 342,949 561,041 2015 2016 2017 Market Value Summary for Gloomy Farms Assets ($) 2013 2014 Current assets Cash, savings, and marketable securities 16,853 17,320 Crops, feed, and supplies 110,265 109,811 Market livestock 94,789 94,751 Accounts receivable 19,458 18,791 Other current assets 35,125 35,427 Total current assets 276,490 276,100 Noncurrent assets Breeding livestock 51,974 57,406 Machinery and equipment 251,279 251,393 Farm real estate 492,453 570,148 Other noncurrent assets 13,500 14,042 Total noncurrent assets 892,988 Total assets - Market Value 1,085,696 1,169,088 16,689 110,708 95,719 18,546 35,588 277,250 16,351 111,133 94,835 18,134 36,548 277,001 17,229 111,841 95,564 18,325 35,831 278,790 63,205 252,133 575,105 14,512 904,954 1,182,204 68,208 252,360 771,795 14,075 1,106,438 1,383,439 72,377 253,171 740,408 14,739 1,080,695 1,359,485 809,206 Income Statement Summary for Gloomy Farms Item ($) 2013 Value of farm production 481,964 Non-depreciation operating expenses 285,975 Depreciation expense 28,156 Unpaid Owner/Family Labour 50,000 Interest expense 34,754 Net income from operations 83,079 Income and social security taxes 7,011 Net income after taxes 76,068 2014 511,235 283,177 24,346 50,000 35,989 117,723 4,360 113,363 2015 505,983 285,197 26,285 50,000 37,664 106,837 7,603 99,234 2016 522,456 281,853 27,237 50,000 35,585 127,781 6,686 121,095 2017 542,356 283,397 29,201 50,000 35,780 143,978 2,877 141,101 2014 2015 2016 2017 17,320 109,811 94,751 18,791 35,427 276,100 16,689 110,708 95,719 18,546 35,588 277,250 16,351 111,133 94,835 18,134 17,229 111,841 95,564 18,325 35,831 278,790 36,548 277,001 Balance Sheet Summary for Gloomy Farms Assets ($) 2013 Current assets Cash, savings, and marketable securities 16,853 Crops, feed, and supplies 110,265 Market livestock 94,789 Accounts receivable 19,458 Other current assets 35,125 Total current assets 276,490 Noncurrent assets Breeding livestock 47,249 Machinery and equipment 251,279 Farm real estate 492,453 Other noncurrent assets 13,500 Total noncurrent assets 804,481 Total assets 1,080,971 Liabilities ($) Current liabilities Operating, short-term notes 94,123 Current maturities 25,897 Accounts payable 8,456 Other current liabilities 84,963 Total current liabilities 213,439 Noncurrent liabilities Non-real estate farm debt 84,187 Real estate farm debt 249,789 Other noncurrent liabilities 10,101 Total noncurrent liabilities 344,077 Total liabilities 557,516 47,838 251,393 492,453 14,042 805,726 1,081,826 48,619 252,133 492,453 14,512 807,717 1,084,967 48,720 252,360 492,453 14,075 807,608 1,084,609 48,251 253,171 492,453 14,739 808,614 1,087,404 94,950 26,648 7,791 85,857 215,246 95,409 27,244 8,103 85,782 216,538 96,278 26,515 8,724 85,969 217,486 96,171 25,836 9,420 86,665 218,092 83,204 250,263 10,202 343,669 558,915 83,387 249,971 10,738 344,096 560,634 82,597 249,128 11,305 343,030 560,516 81,991 249,046 11,912 342,949 561,041 2015 2016 2017 Market Value Summary for Gloomy Farms Assets ($) 2013 2014 Current assets Cash, savings, and marketable securities 16,853 17,320 Crops, feed, and supplies 110,265 109,811 Market livestock 94,789 94,751 Accounts receivable 19,458 18,791 Other current assets 35,125 35,427 Total current assets 276,490 276,100 Noncurrent assets Breeding livestock 51,974 57,406 Machinery and equipment 251,279 251,393 Farm real estate 492,453 570,148 Other noncurrent assets 13,500 14,042 Total noncurrent assets 892,988 Total assets - Market Value 1,085,696 1,169,088 16,689 110,708 95,719 18,546 35,588 277,250 16,351 111,133 94,835 18,134 36,548 277,001 17,229 111,841 95,564 18,325 35,831 278,790 63,205 252,133 575,105 14,512 904,954 1,182,204 68,208 252,360 771,795 14,075 1,106,438 1,383,439 72,377 253,171 740,408 14,739 1,080,695 1,359,485 809,206 Income Statement Summary for Gloomy Farms Item ($) 2013 Value of farm production 481,964 Non-depreciation operating expenses 285,975 Depreciation expense 28,156 Unpaid Owner/Family Labour 50,000 Interest expense 34,754 Net income from operations 83,079 Income and social security taxes 7,011 Net income after taxes 76,068 2014 511,235 283,177 24,346 50,000 35,989 117,723 4,360 113,363 2015 505,983 285,197 26,285 50,000 37,664 106,837 7,603 99,234 2016 522,456 281,853 27,237 50,000 35,585 127,781 6,686 121,095 2017 542,356 283,397 29,201 50,000 35,780 143,978 2,877 141,101


