Can someone please help with this question?
Please only do it if you are 100% with the answer.
Please respond asap.
Note:
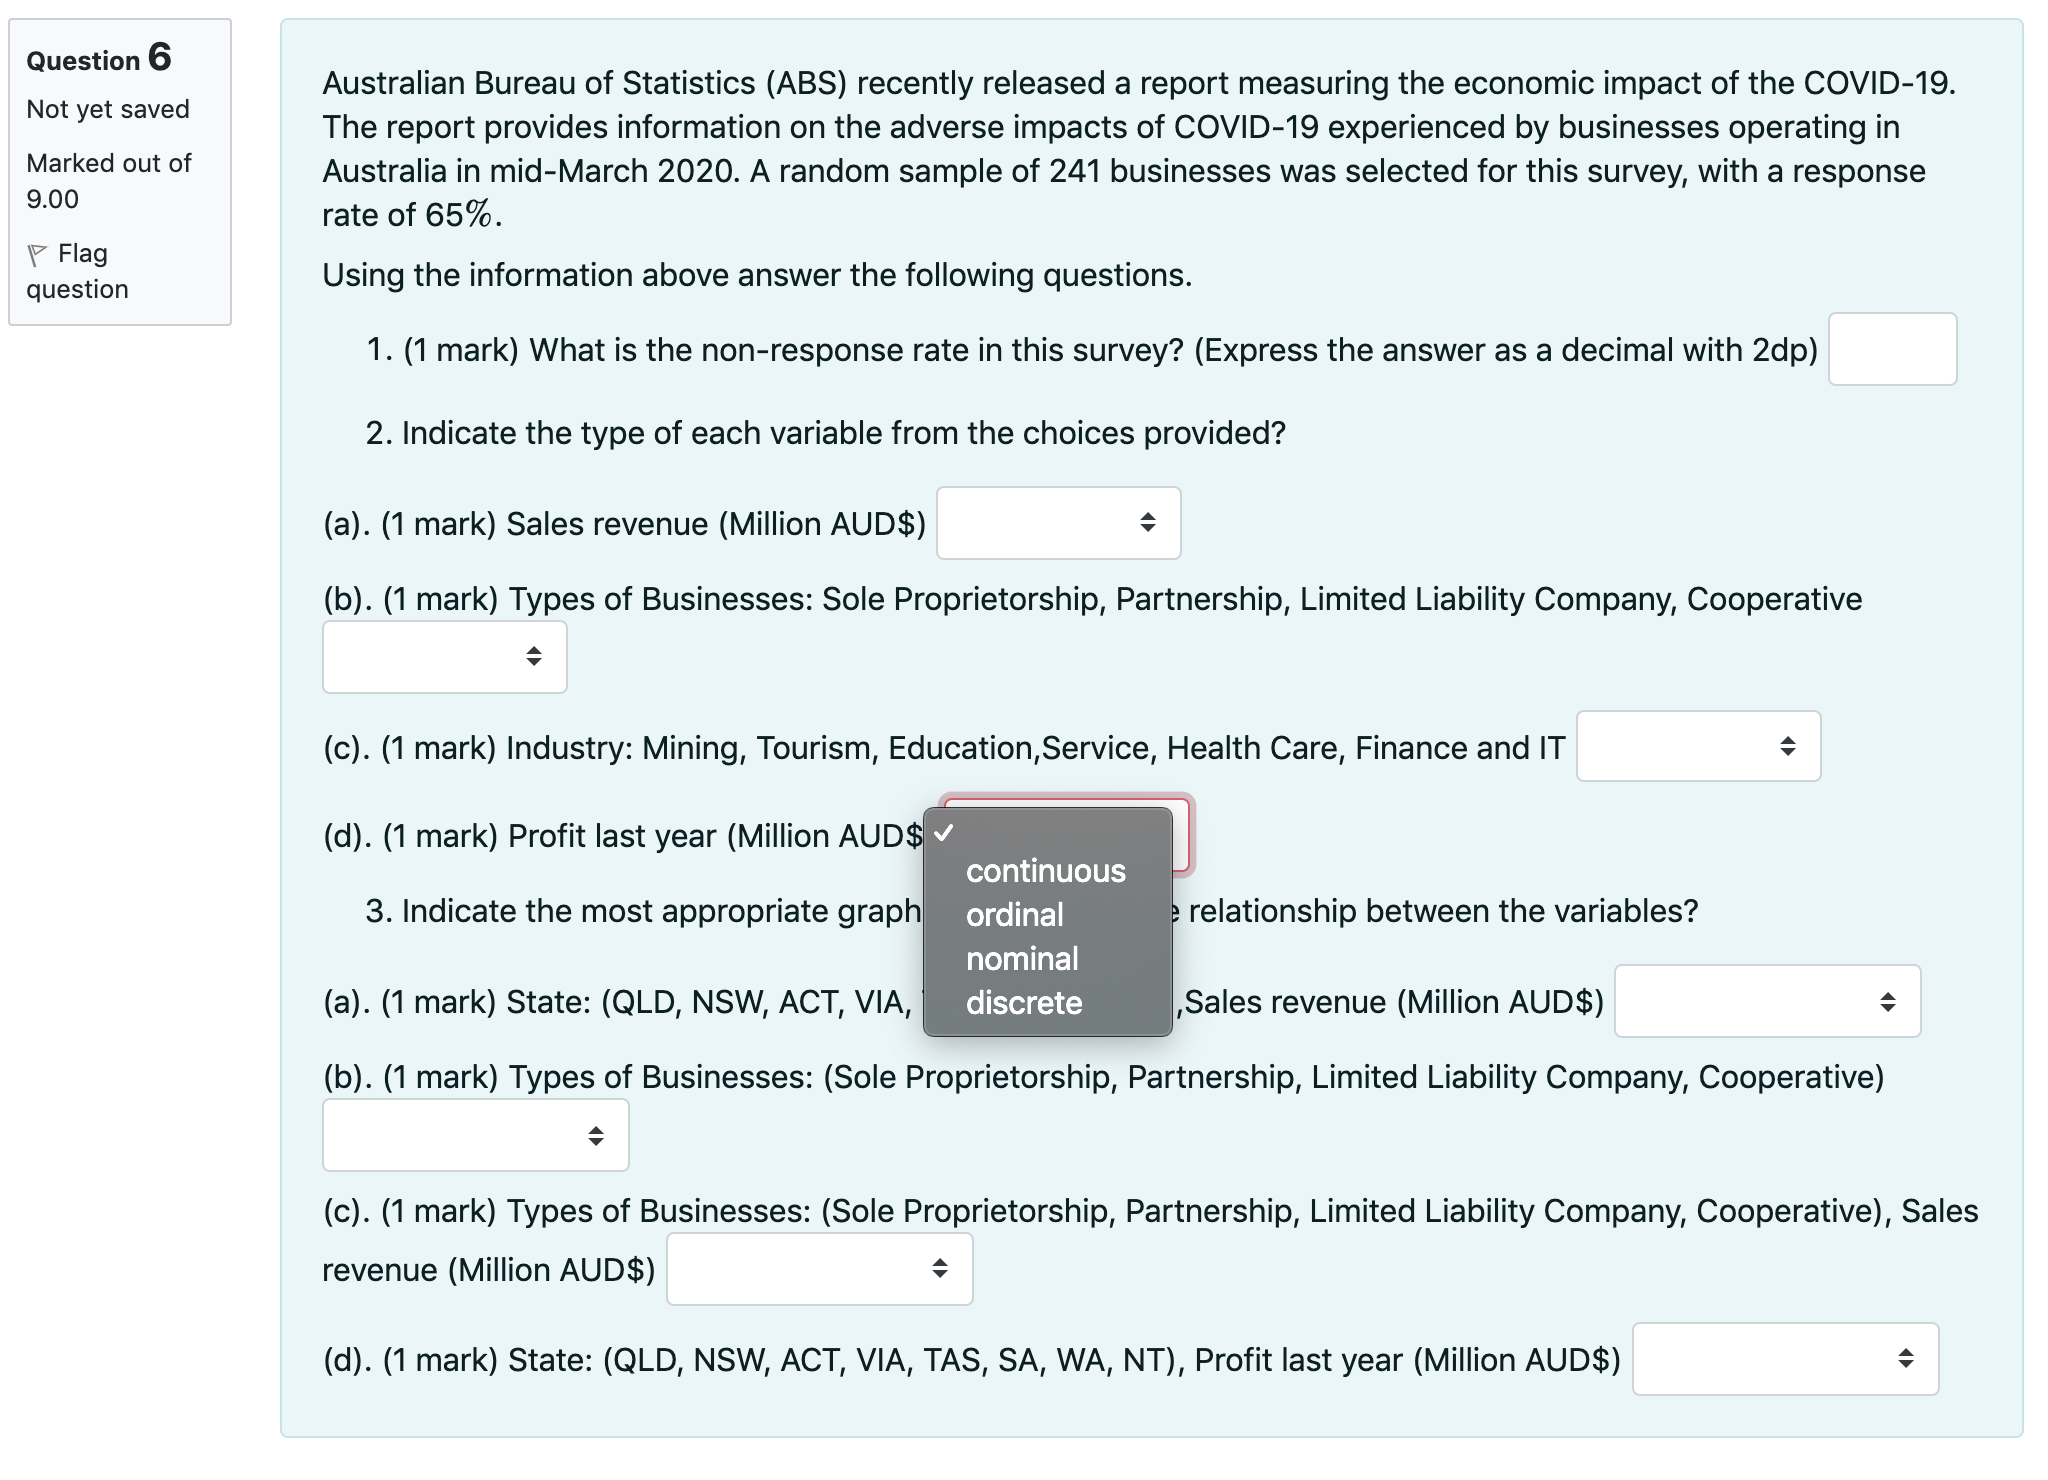
A-D has the same answers as seen in screenshot.
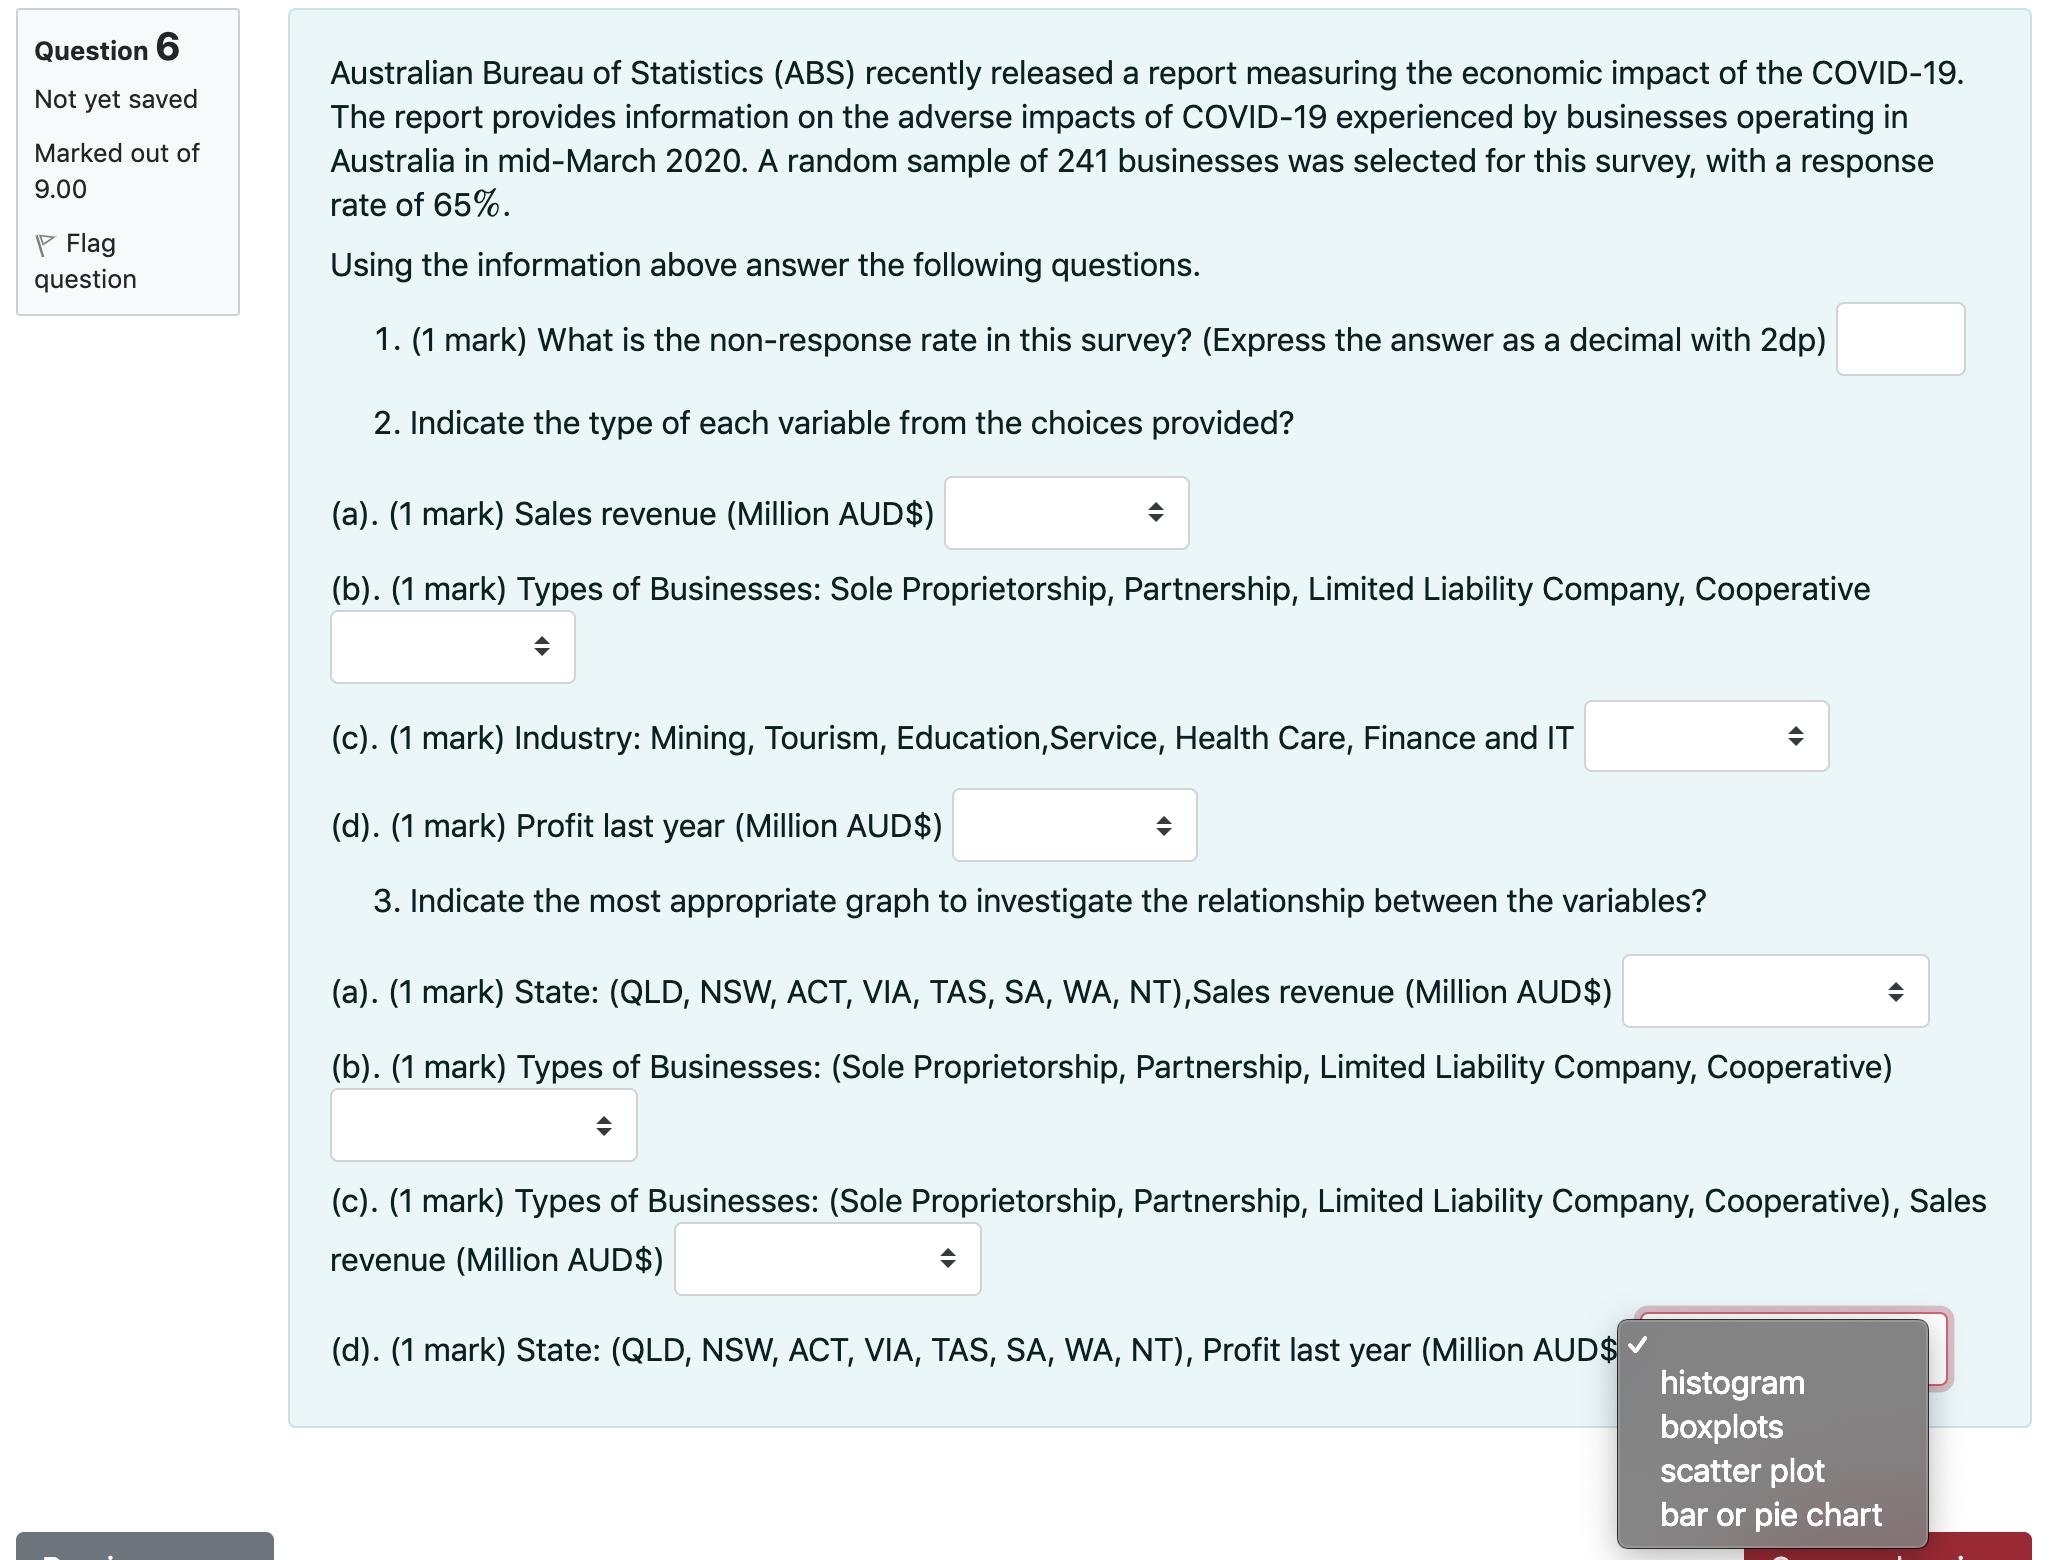
and the second A-D has the same answers as seen in screenshot.
Question 6 Not yet saved Marked out of 9.00 (7 Flag question Australian Bureau of Statistics (ABS) recently released a report measuring the economic impact of the COVID19. The report provides information on the adverse impacts of COVID19 experienced by businesses operating in Australia in mid-March 2020. A random sample of 241 businesses was selected for this survey, with a response rate of 65%. Using the information above answer the following questions. 1. (1 mark) What is the non-response rate in this survey? (Express the answer as a decimal with 2dp) 2. Indicate the type of each variable from the choices provided? (a). (1 mark) Sales revenue (Million AUD$) c (b). (1 mark) Types of Businesses: Sole Proprietorship, Partnership, Limited Liability Company, Cooperative A v 0 (c). (1 mark) Industry: Mining, Tourism, Education,Service, Health Care, Finance and IT (d). (1 mark) Profit last year (Million AUD J I continuous 3. Indicate the most appropriate graph ordinal - relationship between the variables? nominal (a). (1 mark) State: (QLD, NSW, ACT, VIA, discrete ,Sales revenue (Million AUD$) 0 (b). (1 mark) Types of Businesses: (Sole Proprietorship, Partnership, Limited Liability Company, Cooperative) A v (c). (1 mark) Types of Businesses: (Sole Proprietorship, Partnership, Limited Liability Company, Cooperative), Sales revenue (Million AUD$) e (d). (1 mark) State: (QLD, NSW, ACT, VIA, TAS, SA, WA, NT), Profit last year (Million AUD$) 0 Question 6 Australian Bureau of Statistics (ABS) recently released a report measuring the economic impact of the COVID-19. Not yet saved The report provides information on the adverse impacts of COVID-19 experienced by businesses operating in Marked out of Australia in mid-March 2020. A random sample of 241 businesses was selected for this survey, with a response 9.00 rate of 65%. Flag question Using the information above answer the following questions. 1. (1 mark) What is the non-response rate in this survey? (Express the answer as a decimal with 2dp) 2. Indicate the type of each variable from the choices provided? (a). (1 mark) Sales revenue (Million AUD$) (b). (1 mark) Types of Businesses: Sole Proprietorship, Partnership, Limited Liability Company, Cooperative (c). (1 mark) Industry: Mining, Tourism, Education, Service, Health Care, Finance and IT (d). (1 mark) Profit last year (Million AUD$) 3. Indicate the most appropriate graph to investigate the relationship between the variables? (a). (1 mark) State: (QLD, NSW, ACT, VIA, TAS, SA, WA, NT), Sales revenue (Million AUD$) (b). (1 mark) Types of Businesses: (Sole Proprietorship, Partnership, Limited Liability Company, Cooperative) (c). (1 mark) Types of Businesses: (Sole Proprietorship, Partnership, Limited Liability Company, Cooperative), Sales revenue (Million AUD$) (d). (1 mark) State: (QLD, NSW, ACT, VIA, TAS, SA, WA, NT), Profit last year (Million AUD$ histogram boxplots scatter plot bar or pie chart


