Answered step by step
Verified Expert Solution
Question
1 Approved Answer
Can someone please post the answers for parts (2), (3), (4) with the help of the information provided in the 1st question. I need it
Can someone please post the answers for parts (2), (3), (4) with the help of the information provided in the 1st question. I need it ASAP.


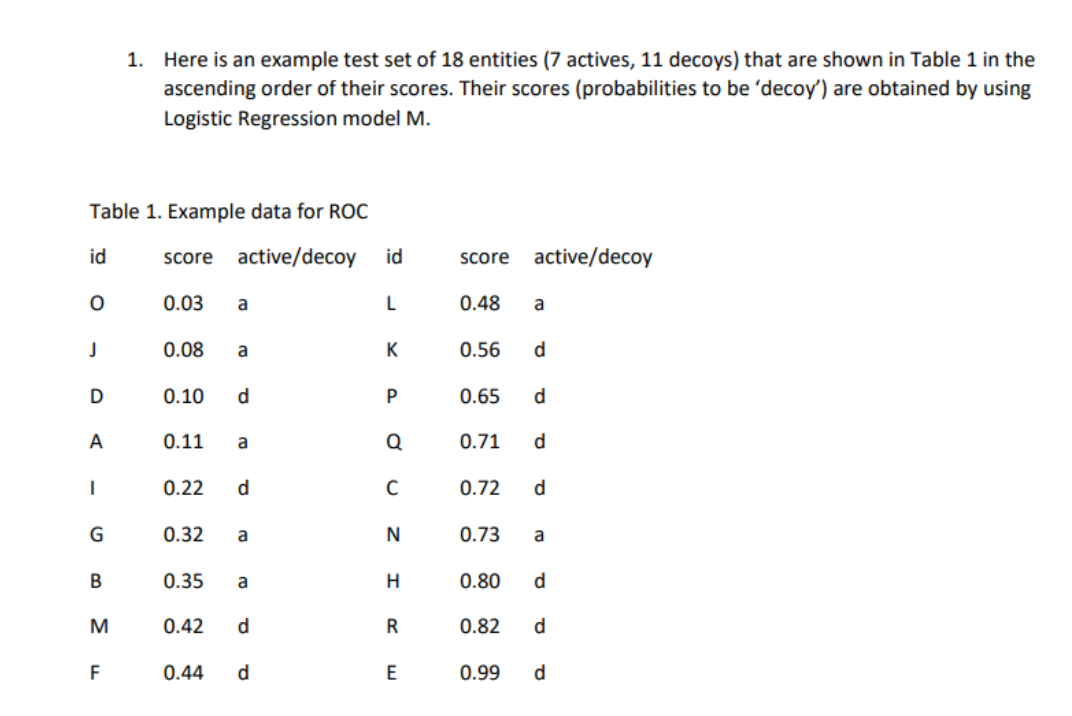
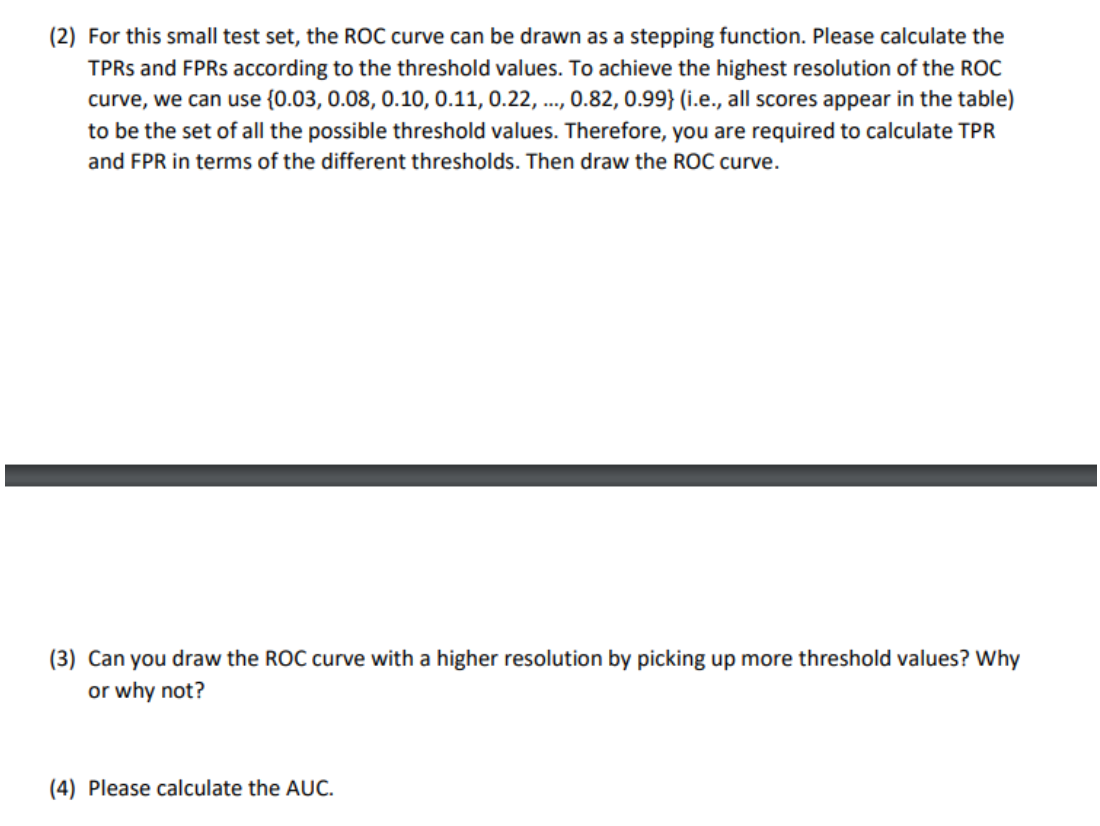
1. Here is an example test set of 18 entities (7 actives, 11 decoys) that are shown in Table 1 in the ascending order of their scores. Their scores (probabilities to be 'decoy') are obtained by using Logistic Regression model M. Table 1. Example data for ROC (2) For this small test set, the ROC curve can be drawn as a stepping function. Please calculate the TPRs and FPRs according to the threshold values. To achieve the highest resolution of the ROC curve, we can use {0.03,0.08,0.10,0.11,0.22,,0.82,0.99} (i.e., all scores appear in the table) to be the set of all the possible threshold values. Therefore, you are required to calculate TPR and FPR in terms of the different thresholds. Then draw the ROC curve. (3) Can you draw the ROC curve with a higher resolution by picking up more threshold values? Why or why not? (4) Please calculate the AUC
Step by Step Solution
There are 3 Steps involved in it
Step: 1

Get Instant Access to Expert-Tailored Solutions
See step-by-step solutions with expert insights and AI powered tools for academic success
Step: 2

Step: 3

Ace Your Homework with AI
Get the answers you need in no time with our AI-driven, step-by-step assistance
Get Started


