

Answered step by step
Verified Expert Solution
Question
1 Approved Answer
Can someone please show me how to format this Excel spreadsheet sheet. The instructions are in the pictures below. Thank you. . Graphing Basics To
Can someone please show me how to format this Excel spreadsheet sheet. The instructions are in the pictures below. Thank you.
.
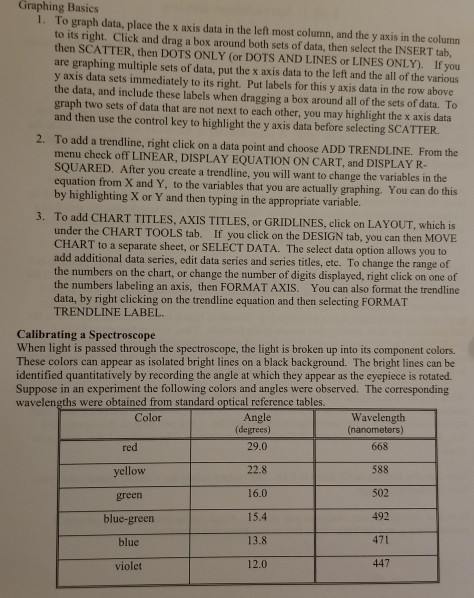
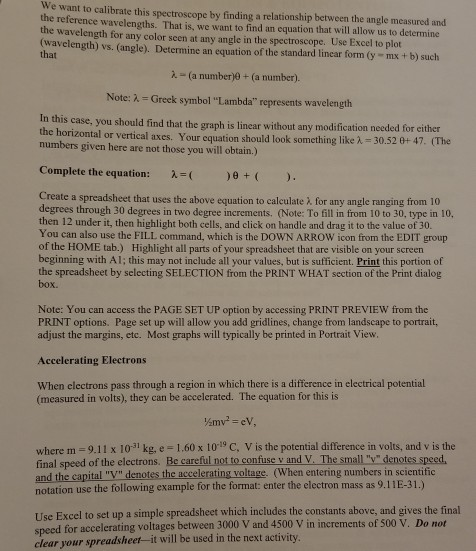
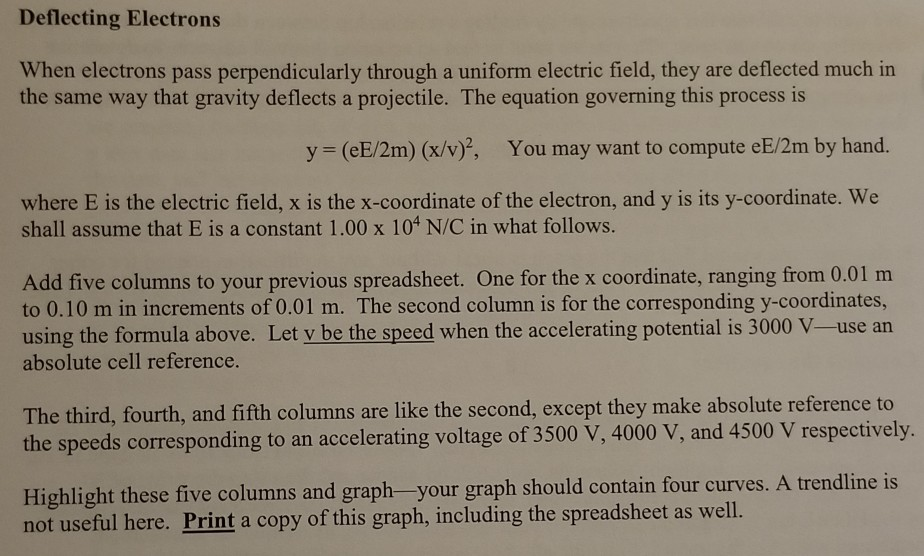
Graphing Basics To graph data, place the x axis data in the left most column, and they axis in the column to its right. Click and drag a box around both sets of data, then select the INSERT tab, then SCATTER, then DOTS ONLY (or DOTS AND LINES or LINES ONLY). If you are graphing multiple sets of data, put the x axis data to the left and the all of the various y axis data sets immediately to its right. Put labels for this yaxis data in the row above the data, and include these labels when dragging a box around all of the sets of data. To graph two sets of data that are not next to each other, you may highlight the xatis data and then use the control key to highlight the y axis data before selecting SCATTER menu check off LINEAR, DISPLAY EQUATION ON CART, and DISPLAY R- SQUARED. After you create a trendline, you will want to change the variables in the equation from X and Y, to the variables that you are actually graphing. You can do this by highlighting X or Y and then typing in the appropriate variable. 3. To add CHART TITLES, AXIS TITLES, or GRIDLINES, click on LAYOUT, which is under the CHART TOOLS tab. If you click on the DESIGN tab, you can then MOVE CHART to a separate sheet, or SELECT DATA. The select data option allows you to add additional data series, edit data series and series titles, etc. To change the range of the numbers on the chart, or change the number of digits displayed, right click on one of the numbers labeling an axis, then FORMAT AXIS. You can also format the trendline data, by right clicking on the trendline equation and then selecting FORMAT TRENDLINE LABEL Calibrating a Spectroscope When light is passed through the spectroscope, the light is broken up into its component colors These colors can appear as isolated bright lines on a black background. The bright lines can be identified quantitatively by recording the angle at which they appear as the eyepiece is rotated. Suppose in an experiment the following colors and angles were observed. The corresponding wavelengths were obtained from standard optical reference tables. Color Angle Wavelength (degrees) (nanometers) red 29.0 668 yellow 588 green 16.0 15.4 502 492 blue-green blue 471 violet 447 we want to calibrate this spectroscope by finding a relationship between the angle measured and the reference wavelengths. That is, we want to find an equation that will allow us to determine the wavelength for any color seen at any angle in the spectroscope. Use Excel to plot (wavelength) vs. (angle). Determine an equation of the standard linear form (y mx+b) such that 2.- (a number) + (a number). Note: = Greek symbol "Lambda" represents wavelength In this case, you should find that the graph is linear without any modification needed for either the horizontal or vertical axes. Your equation should look something like = 30.52 0+ 47. (The numbers given here are not those you will obtain.) Complete the equation: 2=( ) + ( ). Create a spreadsheet that uses the above equation to calculate for any angle ranging from 10 degrees through 30 degrees in two degree increments. (Note: To fill in from 10 to 30, type in 10. then 12 under it, then highlight both cells, and click on handle and drag it to the value of 30 You can also use the FILL command, which is the DOWN ARROW icon from the EDIT group of the HOME tab.) Highlight all parts of your spreadsheet that are visible on your screen beginning with Al; this may not include all your values, but is sufficient. Print this portion of the spreadsheet by selecting SELECTION from the PRINT WHAT section of the Print dialog box. Note: You can access the PAGE SET UP option by accessing PRINT PREVIEW from the PRINT options Page set up will allow you add gridlines, change from landscape to portrait, adjust the margins, etc. Most graphs will typically be printed in Portrait View Accelerating Electrons When electrons pass through a region in which there is a difference in electrical potential (measured in volts), they can be accelerated. The equation for this is mv = CV, where m=9.11 x 10 kg, e1.60 x 10C, V is the potential difference in volts, and vis the final speed of the electrons. Be careful not to confuse v and V. The small "v" denotes speed, and the capital "V" denotes the accelerating voltage. (When entering numbers in scientific notation use the following example for the format: enter the electron mass as 9.11E-31.) Ilse Excel to set up a simple spreadsheet which includes the constants above, and gives the final sneed for accelerating voltages between 3000 V and 4500 V in increments of 500 V. Do not clear your spreadsheet-it will be used in the next activity. Deflecting Electrons When electrons pass perpendicularly through a uniform electric field, they are deflected much in the same way that gravity deflects a projectile. The equation governing this process is y=(eE/2m) (x/v), You may want to compute eE/2m by hand. where E is the electric field, x is the x-coordinate of the electron, and y is its y-coordinate. We Add five columns to your previous spreadsheet. One for the x coordinate, ranging from 0.01 m to 0.10 m in increments of 0.01 m. The second column is for the corresponding y-coordinates, using the formula above. Let y be the speed when the accelerating potential is 3000 V-use an absolute cell reference. The third, fourth, and fifth columns are like the second, except they make absolute reference to the speeds corresponding to an accelerating voltage of 3500 V, 4000 V, and 4500 V respectively. Highlight these five columns and graph-your graph should contain four curves. A trendline is not useful here. Print a copy of this graph, including the spreadsheet as well. Graphing Basics To graph data, place the x axis data in the left most column, and they axis in the column to its right. Click and drag a box around both sets of data, then select the INSERT tab, then SCATTER, then DOTS ONLY (or DOTS AND LINES or LINES ONLY). If you are graphing multiple sets of data, put the x axis data to the left and the all of the various y axis data sets immediately to its right. Put labels for this yaxis data in the row above the data, and include these labels when dragging a box around all of the sets of data. To graph two sets of data that are not next to each other, you may highlight the xatis data and then use the control key to highlight the y axis data before selecting SCATTER menu check off LINEAR, DISPLAY EQUATION ON CART, and DISPLAY R- SQUARED. After you create a trendline, you will want to change the variables in the equation from X and Y, to the variables that you are actually graphing. You can do this by highlighting X or Y and then typing in the appropriate variable. 3. To add CHART TITLES, AXIS TITLES, or GRIDLINES, click on LAYOUT, which is under the CHART TOOLS tab. If you click on the DESIGN tab, you can then MOVE CHART to a separate sheet, or SELECT DATA. The select data option allows you to add additional data series, edit data series and series titles, etc. To change the range of the numbers on the chart, or change the number of digits displayed, right click on one of the numbers labeling an axis, then FORMAT AXIS. You can also format the trendline data, by right clicking on the trendline equation and then selecting FORMAT TRENDLINE LABEL Calibrating a Spectroscope When light is passed through the spectroscope, the light is broken up into its component colors These colors can appear as isolated bright lines on a black background. The bright lines can be identified quantitatively by recording the angle at which they appear as the eyepiece is rotated. Suppose in an experiment the following colors and angles were observed. The corresponding wavelengths were obtained from standard optical reference tables. Color Angle Wavelength (degrees) (nanometers) red 29.0 668 yellow 588 green 16.0 15.4 502 492 blue-green blue 471 violet 447 we want to calibrate this spectroscope by finding a relationship between the angle measured and the reference wavelengths. That is, we want to find an equation that will allow us to determine the wavelength for any color seen at any angle in the spectroscope. Use Excel to plot (wavelength) vs. (angle). Determine an equation of the standard linear form (y mx+b) such that 2.- (a number) + (a number). Note: = Greek symbol "Lambda" represents wavelength In this case, you should find that the graph is linear without any modification needed for either the horizontal or vertical axes. Your equation should look something like = 30.52 0+ 47. (The numbers given here are not those you will obtain.) Complete the equation: 2=( ) + ( ). Create a spreadsheet that uses the above equation to calculate for any angle ranging from 10 degrees through 30 degrees in two degree increments. (Note: To fill in from 10 to 30, type in 10. then 12 under it, then highlight both cells, and click on handle and drag it to the value of 30 You can also use the FILL command, which is the DOWN ARROW icon from the EDIT group of the HOME tab.) Highlight all parts of your spreadsheet that are visible on your screen beginning with Al; this may not include all your values, but is sufficient. Print this portion of the spreadsheet by selecting SELECTION from the PRINT WHAT section of the Print dialog box. Note: You can access the PAGE SET UP option by accessing PRINT PREVIEW from the PRINT options Page set up will allow you add gridlines, change from landscape to portrait, adjust the margins, etc. Most graphs will typically be printed in Portrait View Accelerating Electrons When electrons pass through a region in which there is a difference in electrical potential (measured in volts), they can be accelerated. The equation for this is mv = CV, where m=9.11 x 10 kg, e1.60 x 10C, V is the potential difference in volts, and vis the final speed of the electrons. Be careful not to confuse v and V. The small "v" denotes speed, and the capital "V" denotes the accelerating voltage. (When entering numbers in scientific notation use the following example for the format: enter the electron mass as 9.11E-31.) Ilse Excel to set up a simple spreadsheet which includes the constants above, and gives the final sneed for accelerating voltages between 3000 V and 4500 V in increments of 500 V. Do not clear your spreadsheet-it will be used in the next activity. Deflecting Electrons When electrons pass perpendicularly through a uniform electric field, they are deflected much in the same way that gravity deflects a projectile. The equation governing this process is y=(eE/2m) (x/v), You may want to compute eE/2m by hand. where E is the electric field, x is the x-coordinate of the electron, and y is its y-coordinate. We Add five columns to your previous spreadsheet. One for the x coordinate, ranging from 0.01 m to 0.10 m in increments of 0.01 m. The second column is for the corresponding y-coordinates, using the formula above. Let y be the speed when the accelerating potential is 3000 V-use an absolute cell reference. The third, fourth, and fifth columns are like the second, except they make absolute reference to the speeds corresponding to an accelerating voltage of 3500 V, 4000 V, and 4500 V respectively. Highlight these five columns and graph-your graph should contain four curves. A trendline is not useful here. Print a copy of this graph, including the spreadsheet as well
Step by Step Solution
There are 3 Steps involved in it
Step: 1

Get Instant Access to Expert-Tailored Solutions
See step-by-step solutions with expert insights and AI powered tools for academic success
Step: 2

Step: 3
Ace Your Homework with AI
Get the answers you need in no time with our AI-driven, step-by-step assistance
Get Started
Temporal Databases Research And Practice Lncs 1399
Authors: Opher Etzion ,Sushil Jajodia ,Suryanarayana Sripada
1st Edition
3540645195, 978-3540645191