Answered step by step
Verified Expert Solution
Question
1 Approved Answer
can someone pls answer questions 1 & 2 Table. 2 (s) 1.052 1.613 2.093 2.633 3.094 3.799 4,091 4.791 x (m) 9.41 13.53 16.55 19.40
can someone pls answer questions 1 & 2
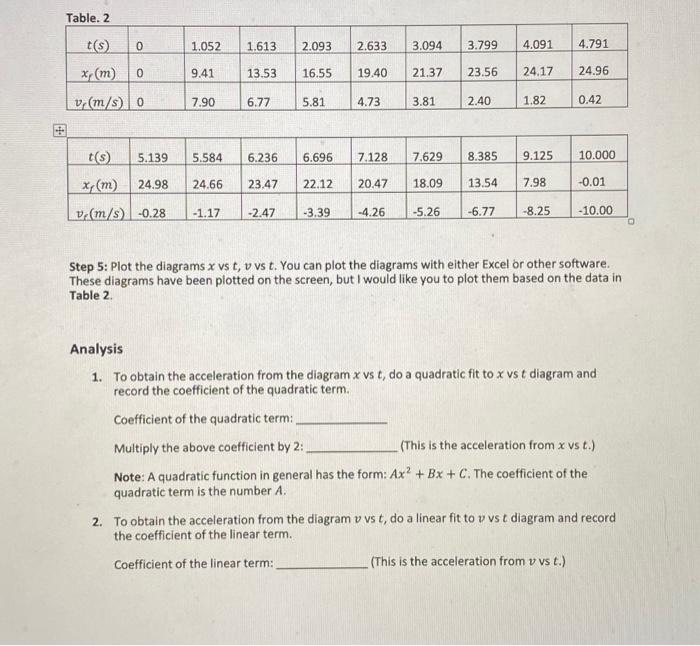
Table. 2 (s) 1.052 1.613 2.093 2.633 3.094 3.799 4,091 4.791 x (m) 9.41 13.53 16.55 19.40 21.37 23.56 24.17 24.96 v. (m/s) 0 7.90 6.77 5.81 4.73 3.81 2.40 1.82 0.42 t(s) 5.139 5.584 6.236 6.696 7.128 7.629 8.385 9.125 10.000 x, (m) 24.98 24.66 23.47 22.12 20.47 18.09 13.54 7.98 -0.01 v. (m/s) -0.28 -1.17 -2.47 -3.39 -4.26 -5.26 6.77 -8.25 -10.00 Step 5: Plot the diagrams x vs t, v vs t. You can plot the diagrams with either Excel or other software. These diagrams have been plotted on the screen, but I would like you to plot them based on the data in Table 2. Analysis 1. To obtain the acceleration from the diagram x vs t, do a quadratic fit to x vs t diagram and record the coefficient of the quadratic term. Coefficient of the quadratic term: Multiply the above coefficient by 2: This is the acceleration from x vs t.) Note: A quadratic function in general has the form: Ax? + Bx + C. The coefficient of the quadratic term is the number A. 2. To obtain the acceleration from the diagram v vs t, do a linear fit to v vs t diagram and record the coefficient of the linear term. Coefficient of the linear term: (This is the acceleration from v vs t.)Step by Step Solution
There are 3 Steps involved in it
Step: 1
Get Instant Access to Expert-Tailored Solutions
See step-by-step solutions with expert insights and AI powered tools for academic success
Step: 2
Step: 3
Ace Your Homework with AI
Get the answers you need in no time with our AI-driven, step-by-step assistance
Get Started