Answered step by step
Verified Expert Solution
Link Copied!

Question

1 Approved Answer

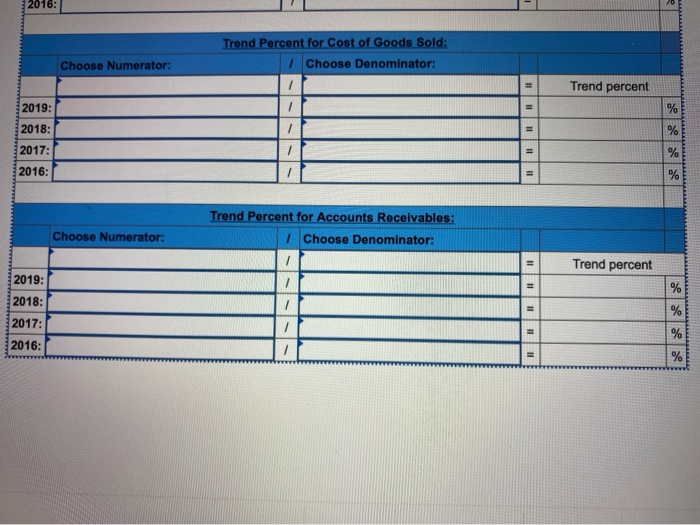
can someone pls help fill out these charts? Exercise 13-3 Computing and interpreting trend percents LO P1 Sales Cost of goods sold Accounts receivable 2019

can someone pls help fill out these charts? image text in transcribed
image text in transcribed
Exercise 13-3 Computing and interpreting trend percents LO P1 Sales Cost of goods sold Accounts receivable 2019 2018 2017 2016 2015 $ 507,110 $ 333,625 $ 272,347 $ 191,121 $ 143,700 250,984 165,076 136,550 94,899 70,413 24,696 19,450 18,656 11,181 9,872 Compute trend percents for the above accounts, using 2015 as the base year. Trend Percent for Net Sales: 1 Choose Denominator: Choose Numerator: Il Trend percent 2019: % % 2018: 2017: 2016: % % Trend Percent for Cost of Goods Sold: 1 Choose Denominator: Choose Numerator: Trend percent 2019 % 2018: % 2017: % 2016: = % 2016: Trend Percent for Cost of Goods Sold: 1 Choose Denominator: Choose Numerator: F F Trend percent 2019: 1 % 11 11 2018: % 2017: % 2016: = % Trend Percent for Accounts Receivables: 1 Choose Denominator: Choose Numerator: 11 Trend percent 2019: / 11 % 1 2018: 2017: 2016: % % %

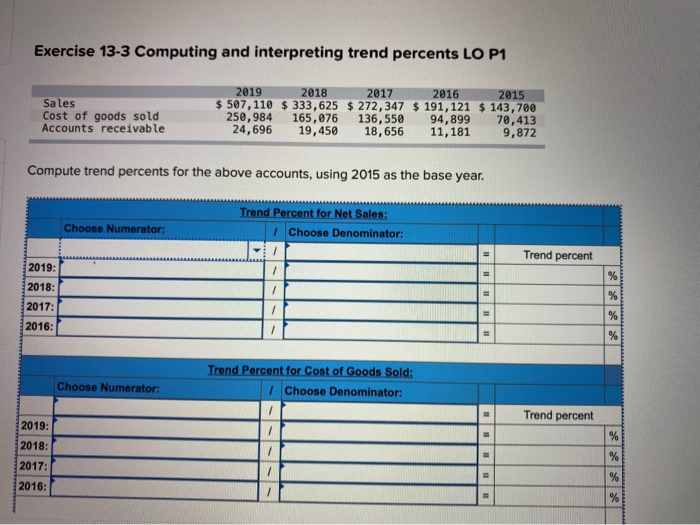
Step by Step Solution

There are 3 Steps involved in it

Step: 1

blur-text-image

Get Instant Access to Expert-Tailored Solutions

See step-by-step solutions with expert insights and AI powered tools for academic success

Step: 2

blur-text-image

Step: 3

blur-text-image

Ace Your Homework with AI

Get the answers you need in no time with our AI-driven, step-by-step assistance

Get Started

Recommended Textbook for

Essential Bookkeeping And Financial Accounting

Authors: Emile Woolf International

1st Edition

1848437552, 978-1848437555

More Books

Students also viewed these Accounting questions

Question

List and describe some major worker protection laws.

Answered: 1 week ago

Question

6. Identify characteristics of whiteness.

Answered: 1 week ago

Question

e. What are notable achievements of the group?

Answered: 1 week ago