Answered step by step
Verified Expert Solution
Question
1 Approved Answer
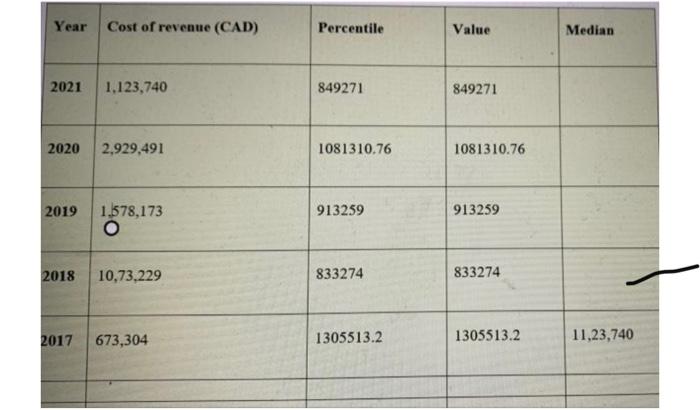
can u explain this question of how the percentile was gotten through the use of excel Year Cost of revenue (CAD) Percentile Value Median 2021
can u explain this question of how the percentile was gotten through the use of excel 
Year Cost of revenue (CAD) Percentile Value Median 2021 1,123,740 849271 849271 2020 2,929,491 1081310.76 1081310.76 2019 1.1578,173 913259 913259 2018 10,73,229 833274 833274 2017 673,304 1305513.2 1305513.2 11,23,740 
Step by Step Solution
There are 3 Steps involved in it
Step: 1

Get Instant Access to Expert-Tailored Solutions
See step-by-step solutions with expert insights and AI powered tools for academic success
Step: 2

Step: 3

Ace Your Homework with AI
Get the answers you need in no time with our AI-driven, step-by-step assistance
Get Started


