can you answer please
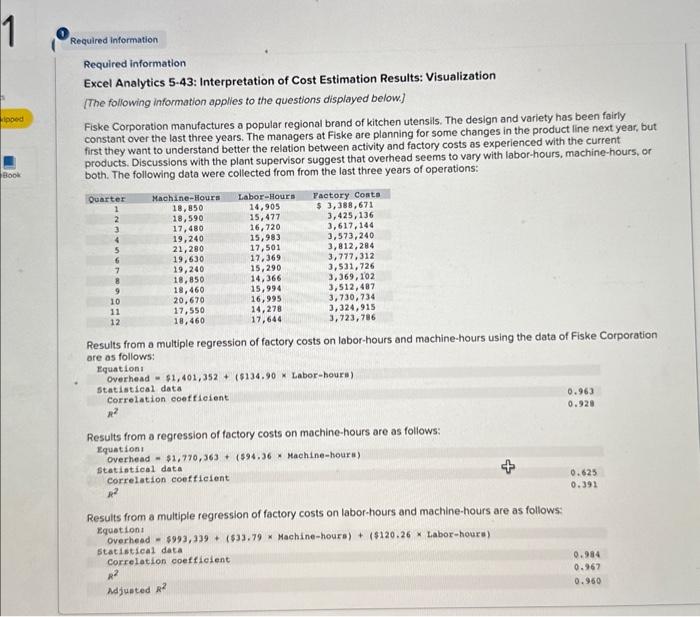
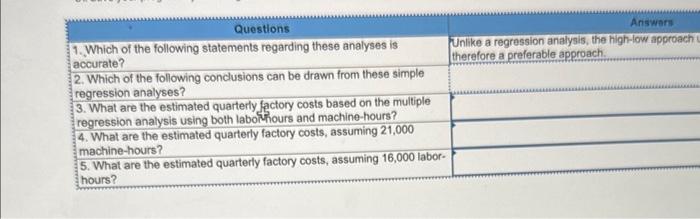
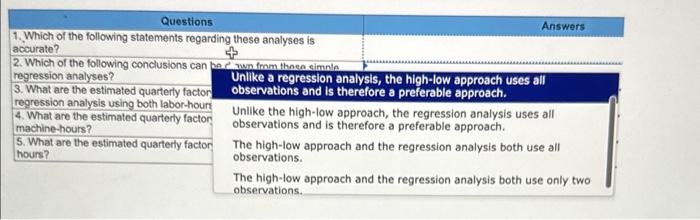
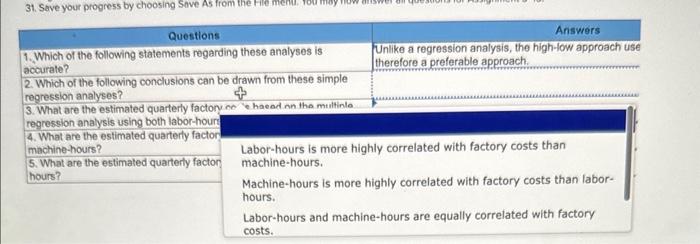
Required information Required information Excel Analytics 5-43: Interpretation of Cost Estimation Results: Visualization [The following information applies to the questions displayed below.] Fiske Corporation manufactures a popular regional brand of kitchen utensils. The design and variety has been fairly constant over the last three years. The managers at Fiske are planning for some changes in the product line next year, but first they want to understand better the relation between activity and factory costs as experienced with the current products. Discussions with the plant supervisor suggest that overhead seems to vary with labor-hours, machine-hours, or both. The following data were collected from from the last three years of operations: Results from a multiple regression of factory costs on labor-hours and machine-hours using the data of Fiske Corporation are as follows: Results from a regression of factory costs on machine-hours are as follows: Equationt overhead =$1,770,363+($94.36 Machine-houra) Statintical data Correlation coefticient R2 Results from a multiple regression of factory costs on labor-hours and machine-hours are as follows: Rquetion Overheed =$993,339+(533.79 Machine-houra )+($120.26 Labor-houra) statistical data Correlation coeffiejent R2 Adjueted R2 1. Which of the following statements regarding these analyses is Answar: accurate? Unlike a regression analysis, the high-low approach : 2. Which of the following conclusions can be drawn from these simple regression analyses? 3. What are the estimated quarterly factory costs based on the multiple regression analysis using both labothours and machine-hours? 4. What are the estimated quarterly factory costs, assuming 21,000 machine-hours? 5. What are the estimated quarterly factory costs, assuming 16,000 laborhours? Required information Required information Excel Analytics 5-43: Interpretation of Cost Estimation Results: Visualization [The following information applies to the questions displayed below.] Fiske Corporation manufactures a popular regional brand of kitchen utensils. The design and variety has been fairly constant over the last three years. The managers at Fiske are planning for some changes in the product line next year, but first they want to understand better the relation between activity and factory costs as experienced with the current products. Discussions with the plant supervisor suggest that overhead seems to vary with labor-hours, machine-hours, or both. The following data were collected from from the last three years of operations: Results from a multiple regression of factory costs on labor-hours and machine-hours using the data of Fiske Corporation are as follows: Results from a regression of factory costs on machine-hours are as follows: Equationt overhead =$1,770,363+($94.36 Machine-houra) Statintical data Correlation coefticient R2 Results from a multiple regression of factory costs on labor-hours and machine-hours are as follows: Rquetion Overheed =$993,339+(533.79 Machine-houra )+($120.26 Labor-houra) statistical data Correlation coeffiejent R2 Adjueted R2 1. Which of the following statements regarding these analyses is Answar: accurate? Unlike a regression analysis, the high-low approach : 2. Which of the following conclusions can be drawn from these simple regression analyses? 3. What are the estimated quarterly factory costs based on the multiple regression analysis using both labothours and machine-hours? 4. What are the estimated quarterly factory costs, assuming 21,000 machine-hours? 5. What are the estimated quarterly factory costs, assuming 16,000 laborhours