

Answered step by step
Verified Expert Solution
Question
1 Approved Answer
can you answer these questions ? a Ch 08: Assignment Risk and Rates of Return 2. Statistical measures of stand-alone risk Remember, the expected value
can you answer these questions ? 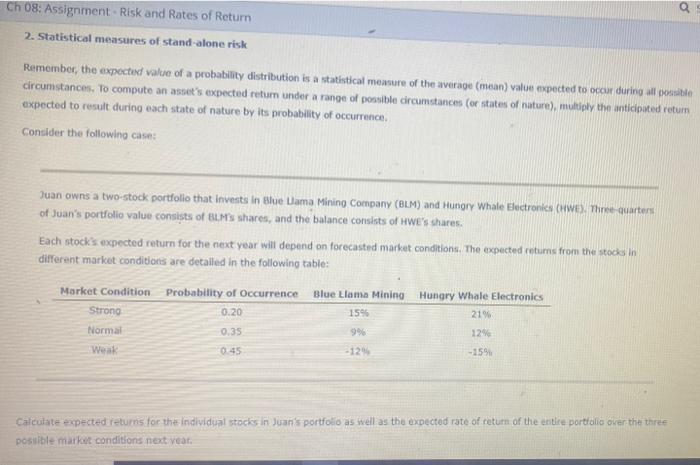
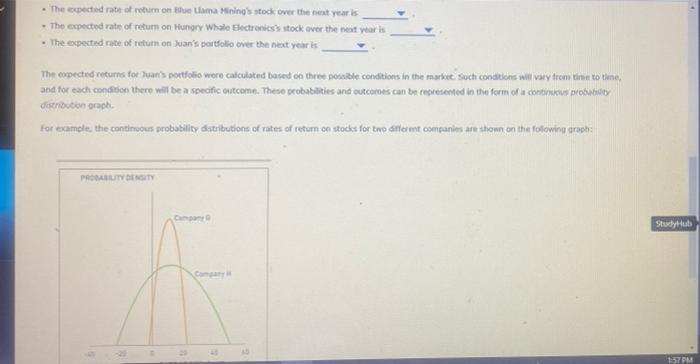
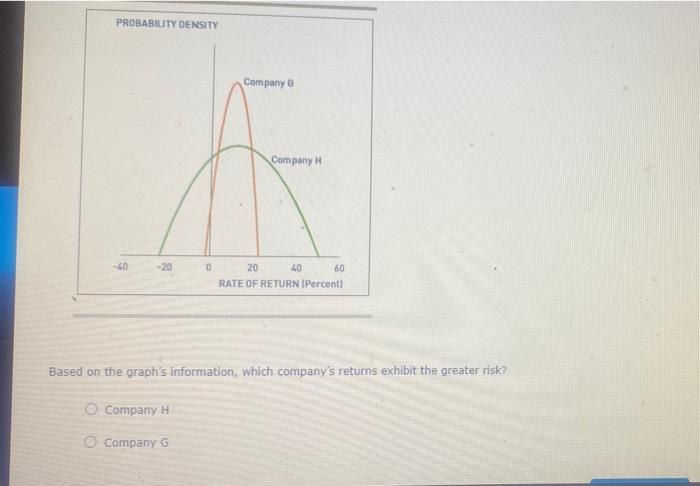
a Ch 08: Assignment Risk and Rates of Return 2. Statistical measures of stand-alone risk Remember, the expected value of a probability distribution is a statistical measure of the average mean) valve expected to occur during all posible circumstances, to compute an asset's expected return under a range of possible circumstances (or states of nature), multiply the anticipated retum expected to result during each state of nature by its probability of occurrence. Consider the following case: Juan owns a two-stock portfolio that invests in Blue Ulama Mining Company (BLM) and Hungry Whale Electronies (HWE), Three quarters of Juan's portfolio value consists of BLM's shares, and the balance consists of HWE's shares. Each stock's expected return for the next year will depend on forecasted market conditions. The expected returns from the stocks in different market conditions are detailed in the following table: Market Condition Probability of Occurrence Blue Llama Mining Hungry Whale Electronics Strong 0.20 15 21% Normal 0.35 12% Weak 0.45 -129 -159 Calculate expected returns for the individual stocks in Juan's portfolio as well as the expected rate of return of the entire portfolio over the three possible market conditions next year. The expected rate of return on Blue Lama Mining's stock over the next year is . The expected rate of return on Hungry Whale Blectronics stock over the next year is The expected rate of return on Juan's portfolio over the next year is The copected returns for Juan's portfolio were calculated based on three possible conditions in the market. Such conditions will vary from time to time, and for each condition there will be a specific outcome. These probabilities and outcomes can be represented in the form of a continuous probability distribution graph for example, the continuous probability datributions of rates of return on stocks for two different companies are shown on the following crash: PRODUTYDENSITY Study CH 157 PM PROBABILITY DENSITY Company G -40 20 20 40 60 RATE OF RETURN (Percent) Based on the graph's information, which company's returns exhibit the greater risk? O Company H Company G Step by Step Solution
There are 3 Steps involved in it
Step: 1

Get Instant Access to Expert-Tailored Solutions
See step-by-step solutions with expert insights and AI powered tools for academic success
Step: 2

Step: 3
Ace Your Homework with AI
Get the answers you need in no time with our AI-driven, step-by-step assistance
Get Started
Bitcoin Goes Kaboom Caveat Emptor Let The Buyer Beware
Authors: William Peterson
1st Edition
1494334763, 978-1494334765