

Answered step by step
Verified Expert Solution
Question
1 Approved Answer
can you answer to these question begin{tabular}{|c|r|r|} hline 1 & multicolumn{1}{|l|}{ Date } & Dividends Ann hline 2 & 2/23/2017 & 1.441182 hline
can you answer to these question 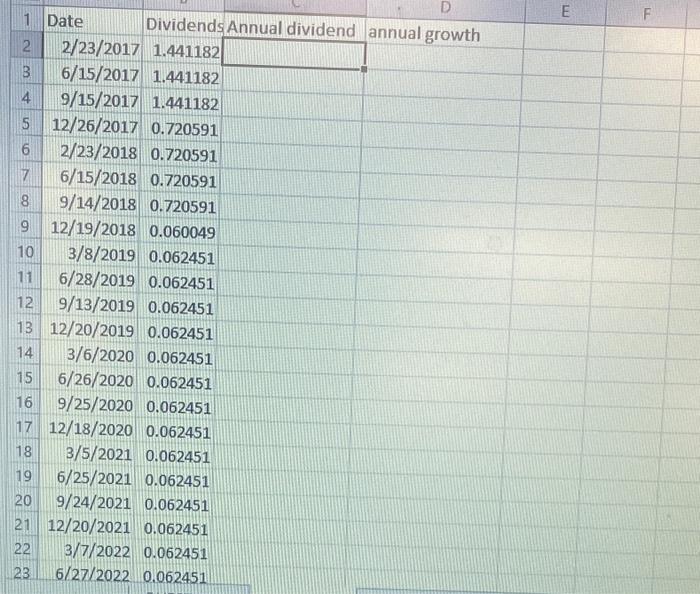
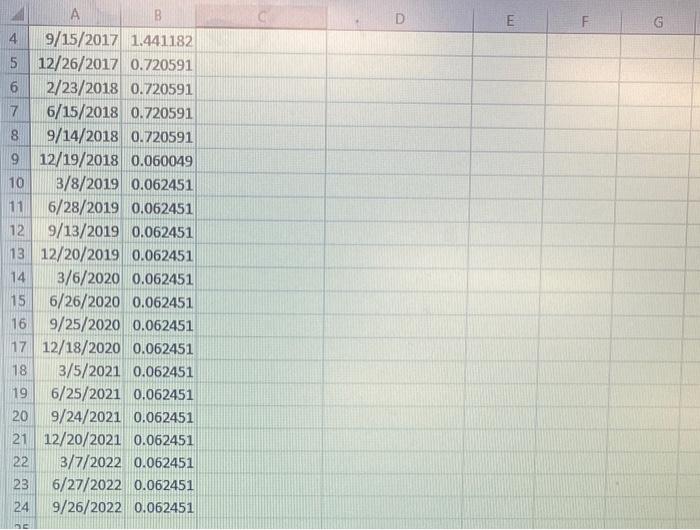
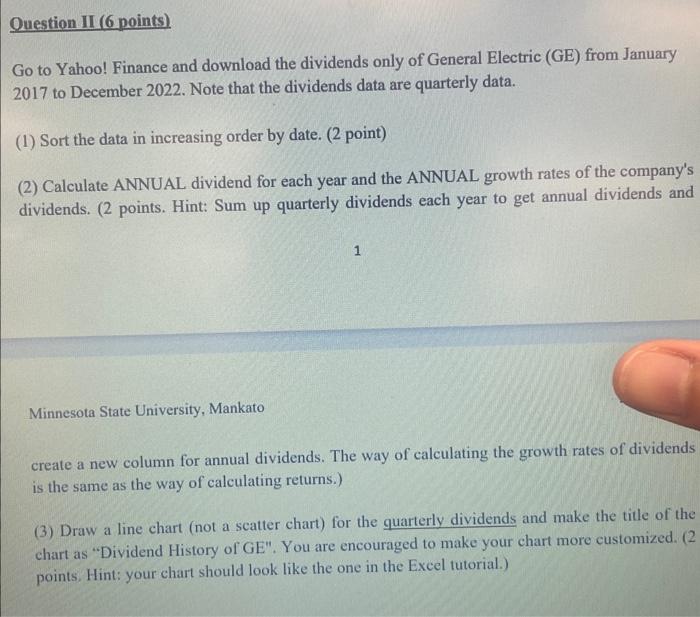
\begin{tabular}{|c|r|r|} \hline 1 & \multicolumn{1}{|l|}{ Date } & Dividends Ann \\ \hline 2 & 2/23/2017 & 1.441182 \\ \hline 3 & 6/15/2017 & 1.441182 \\ \hline 4 & 9/15/2017 & 1.441182 \\ \hline 5 & 12/26/2017 & 0.720591 \\ \hline 6 & 2/23/2018 & 0.720591 \\ \hline 7 & 6/15/2018 & 0.720591 \\ \hline 8 & 9/14/2018 & 0.720591 \\ \hline 9 & 12/19/2018 & 0.060049 \\ \hline 10 & 3/8/2019 & 0.062451 \\ \hline 11 & 6/28/2019 & 0.062451 \\ \hline 12 & 9/13/2019 & 0.062451 \\ \hline 13 & 12/20/2019 & 0.062451 \\ \hline 14 & 3/6/2020 & 0.062451 \\ \hline 15 & 6/26/2020 & 0.062451 \\ \hline 16 & 9/25/2020 & 0.062451 \\ \hline 17 & 12/18/2020 & 0.062451 \\ \hline 18 & 3/5/2021 & 0.062451 \\ \hline 19 & 6/25/2021 & 0.062451 \\ \hline 20 & 9/24/2021 & 0.062451 \\ \hline 21 & 12/20/2021 & 0.062451 \\ \hline 22 & 3/7/2022 & 0.062451 \\ \hline 23 & 6/27/2022 & 0.062451 \\ \hline \end{tabular} \begin{tabular}{l|r|c|} \hline & \multicolumn{1}{|c}{A} & B \\ \hline 4 & 9/15/2017 & 1.441182 \\ \hline 5 & 12/26/2017 & 0.720591 \\ \hline 6 & 2/23/2018 & 0.720591 \\ \hline 7 & 6/15/2018 & 0.720591 \\ \hline 8 & 9/14/2018 & 0.720591 \\ \hline 9 & 12/19/2018 & 0.060049 \\ \hline 10 & 3/8/2019 & 0.062451 \\ \hline 11 & 6/28/2019 & 0.062451 \\ \hline 12 & 9/13/2019 & 0.062451 \\ \hline 13 & 12/20/2019 & 0.062451 \\ 14 & 3/6/2020 & 0.062451 \\ \hline 15 & 6/26/2020 & 0.062451 \\ \hline 16 & 9/25/2020 & 0.062451 \\ \hline 17 & 12/18/2020 & 0.062451 \\ \hline 18 & 3/5/2021 & 0.062451 \\ \hline 19 & 6/25/2021 & 0.062451 \\ \hline 20 & 9/24/2021 & 0.062451 \\ \hline 21 & 12/20/2021 & 0.062451 \\ \hline 22 & 3/7/2022 & 0.062451 \\ \hline 23 & 6/27/2022 & 0.062451 \\ \hline 24 & 9/26/2022 & 0.062451 \\ \hline \end{tabular} Go to Yahoo! Finance and download the dividends only of General Electric (GE) from January 2017 to December 2022 . Note that the dividends data are quarterly data. (1) Sort the data in increasing order by date. ( 2 point) (2) Calculate ANNUAL dividend for each year and the ANNUAL growth rates of the company's dividends. ( 2 points. Hint: Sum up quarterly dividends each year to get annual dividends and 1 Minnesota State University, Mankato create a new column for annual dividends. The way of calculating the growth rates of dividends is the same as the way of calculating returns.) (3) Draw a line chart (not a scatter chart) for the quarterly dividends and make the title of the chart as "Dividend History of GE". You are encouraged to make your chart more customized. (2) points. Hint: your chart should look like the one in the Excel tutorial.) \begin{tabular}{|c|r|r|} \hline 1 & \multicolumn{1}{|l|}{ Date } & Dividends Ann \\ \hline 2 & 2/23/2017 & 1.441182 \\ \hline 3 & 6/15/2017 & 1.441182 \\ \hline 4 & 9/15/2017 & 1.441182 \\ \hline 5 & 12/26/2017 & 0.720591 \\ \hline 6 & 2/23/2018 & 0.720591 \\ \hline 7 & 6/15/2018 & 0.720591 \\ \hline 8 & 9/14/2018 & 0.720591 \\ \hline 9 & 12/19/2018 & 0.060049 \\ \hline 10 & 3/8/2019 & 0.062451 \\ \hline 11 & 6/28/2019 & 0.062451 \\ \hline 12 & 9/13/2019 & 0.062451 \\ \hline 13 & 12/20/2019 & 0.062451 \\ \hline 14 & 3/6/2020 & 0.062451 \\ \hline 15 & 6/26/2020 & 0.062451 \\ \hline 16 & 9/25/2020 & 0.062451 \\ \hline 17 & 12/18/2020 & 0.062451 \\ \hline 18 & 3/5/2021 & 0.062451 \\ \hline 19 & 6/25/2021 & 0.062451 \\ \hline 20 & 9/24/2021 & 0.062451 \\ \hline 21 & 12/20/2021 & 0.062451 \\ \hline 22 & 3/7/2022 & 0.062451 \\ \hline 23 & 6/27/2022 & 0.062451 \\ \hline \end{tabular} \begin{tabular}{l|r|c|} \hline & \multicolumn{1}{|c}{A} & B \\ \hline 4 & 9/15/2017 & 1.441182 \\ \hline 5 & 12/26/2017 & 0.720591 \\ \hline 6 & 2/23/2018 & 0.720591 \\ \hline 7 & 6/15/2018 & 0.720591 \\ \hline 8 & 9/14/2018 & 0.720591 \\ \hline 9 & 12/19/2018 & 0.060049 \\ \hline 10 & 3/8/2019 & 0.062451 \\ \hline 11 & 6/28/2019 & 0.062451 \\ \hline 12 & 9/13/2019 & 0.062451 \\ \hline 13 & 12/20/2019 & 0.062451 \\ 14 & 3/6/2020 & 0.062451 \\ \hline 15 & 6/26/2020 & 0.062451 \\ \hline 16 & 9/25/2020 & 0.062451 \\ \hline 17 & 12/18/2020 & 0.062451 \\ \hline 18 & 3/5/2021 & 0.062451 \\ \hline 19 & 6/25/2021 & 0.062451 \\ \hline 20 & 9/24/2021 & 0.062451 \\ \hline 21 & 12/20/2021 & 0.062451 \\ \hline 22 & 3/7/2022 & 0.062451 \\ \hline 23 & 6/27/2022 & 0.062451 \\ \hline 24 & 9/26/2022 & 0.062451 \\ \hline \end{tabular} Go to Yahoo! Finance and download the dividends only of General Electric (GE) from January 2017 to December 2022 . Note that the dividends data are quarterly data. (1) Sort the data in increasing order by date. ( 2 point) (2) Calculate ANNUAL dividend for each year and the ANNUAL growth rates of the company's dividends. ( 2 points. Hint: Sum up quarterly dividends each year to get annual dividends and 1 Minnesota State University, Mankato create a new column for annual dividends. The way of calculating the growth rates of dividends is the same as the way of calculating returns.) (3) Draw a line chart (not a scatter chart) for the quarterly dividends and make the title of the chart as "Dividend History of GE". You are encouraged to make your chart more customized. (2) points. Hint: your chart should look like the one in the Excel tutorial.) Step by Step Solution
There are 3 Steps involved in it
Step: 1

Get Instant Access to Expert-Tailored Solutions
See step-by-step solutions with expert insights and AI powered tools for academic success
Step: 2

Step: 3
Ace Your Homework with AI
Get the answers you need in no time with our AI-driven, step-by-step assistance
Get Started
Mastering Sports Analytics With R Insights From Soccer Nba Nfl Baseball Hockey Tennis Golf And Boxing
Authors: Lauren Gallardo
1st Edition
B0CHGB9X8T, 979-8860571174