Answered step by step
Verified Expert Solution
Question
1 Approved Answer
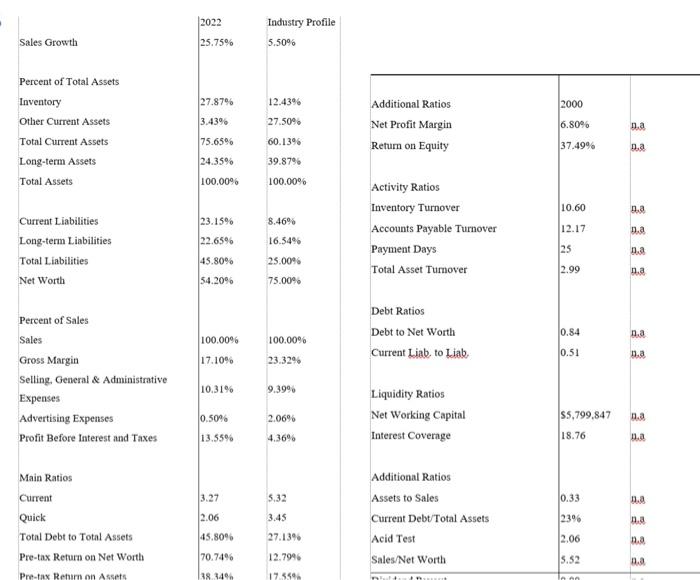
can you explain and analyse it 2022 25.75% Industry Profile 5.5096 Sales Growth 12.4396 2000 27.87% 3.43% 75.656 Percent of Total Assets Inventory Other Current
can you explain and analyse it 
2022 25.75% Industry Profile 5.5096 Sales Growth 12.4396 2000 27.87% 3.43% 75.656 Percent of Total Assets Inventory Other Current Assets Total Current Assets Long-term Assets Total Assets 6.80% Additional Ratios Net Profit Margin Return on Equity na 27.50% 60.13% 37.49% na 24.35% 39.8796 100.00% 100.00% 10.60 na 23.15% 8.46% Activity Ratios Inventory Turnover Accounts Payable Turnover Payment Days Total Asset Tumover 12.17 n.a 22.65% Current Liabilities Long-term Liabilities Total Liabilities Net Worth 16.54% as na 25.00% 45.80% 54.20% 2.99 n.a 75.00% Debt Ratios Debt to Net Worth Current Liab to Liab 0.84 na 100.00% 100.00% 17.10% 0.51 n.a 23.3296 Percent of Sales Sales Gross Margin Selling. General & Administrative Expenses Advertising Expenses Profit Before Interest and Taxes 10.31% 9.399 2.06% Liquidity Ratios Net Working Capital Interest Coverage 0.50% 13.55% na $5,799,847 18.76 4.36% Da 5.32 0.33 a Main Ratios Current Quick Total Debt to Total Assets Pre-tax Return on Net Worth 3.27 2.06 45.8096 3.45 Additional Ratios Assets to Sales Current Debt/Total Assets Acid Test Sales/Net Worth 23% na 27.13% 2.06 na 12.7996 5.52 n.a 70.74% 38 34 Pre-tax Rehim on Assets 17.359 Inn 2022 25.75% Industry Profile 5.5096 Sales Growth 12.4396 2000 27.87% 3.43% 75.656 Percent of Total Assets Inventory Other Current Assets Total Current Assets Long-term Assets Total Assets 6.80% Additional Ratios Net Profit Margin Return on Equity na 27.50% 60.13% 37.49% na 24.35% 39.8796 100.00% 100.00% 10.60 na 23.15% 8.46% Activity Ratios Inventory Turnover Accounts Payable Turnover Payment Days Total Asset Tumover 12.17 n.a 22.65% Current Liabilities Long-term Liabilities Total Liabilities Net Worth 16.54% as na 25.00% 45.80% 54.20% 2.99 n.a 75.00% Debt Ratios Debt to Net Worth Current Liab to Liab 0.84 na 100.00% 100.00% 17.10% 0.51 n.a 23.3296 Percent of Sales Sales Gross Margin Selling. General & Administrative Expenses Advertising Expenses Profit Before Interest and Taxes 10.31% 9.399 2.06% Liquidity Ratios Net Working Capital Interest Coverage 0.50% 13.55% na $5,799,847 18.76 4.36% Da 5.32 0.33 a Main Ratios Current Quick Total Debt to Total Assets Pre-tax Return on Net Worth 3.27 2.06 45.8096 3.45 Additional Ratios Assets to Sales Current Debt/Total Assets Acid Test Sales/Net Worth 23% na 27.13% 2.06 na 12.7996 5.52 n.a 70.74% 38 34 Pre-tax Rehim on Assets 17.359 Inn 
Step by Step Solution
There are 3 Steps involved in it
Step: 1

Get Instant Access to Expert-Tailored Solutions
See step-by-step solutions with expert insights and AI powered tools for academic success
Step: 2

Step: 3

Ace Your Homework with AI
Get the answers you need in no time with our AI-driven, step-by-step assistance
Get Started


