Question
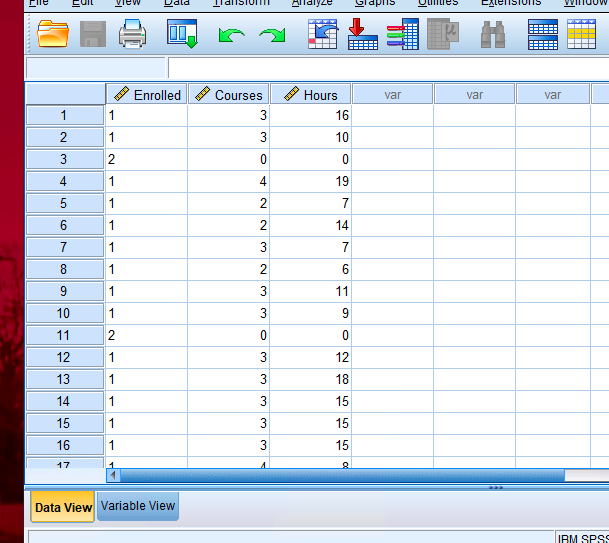
Can you explain how to answer these questions using SPSS? The data information is attached as an image 1)The administration provides you with data gathered
Can you explain how to answer these questions using SPSS? The data information is attached as an image
1)The administration provides you with data gathered from a recent student enrollment survey
Use data set Lab1_Ex1
a)How many variables does the dataset include? Write the type for each variable.
3 Variables:
Enrolled: ?
Courses: ?
Hours: ?
b)Run descriptive statistics and a chart (histogram or bar chart?) for Enrolled variable. Include screen shot
c)Run descriptive statistics and a chart (histogram or bar chart?) for Courses but only for students who are enrolled. Include screen shot
d)Run descriptive statistics and a chart (histogram or bar chart?) for Hours but only for students who are enrolled. Include screen shot

Step by Step Solution
There are 3 Steps involved in it
Step: 1

Get Instant Access to Expert-Tailored Solutions
See step-by-step solutions with expert insights and AI powered tools for academic success
Step: 2

Step: 3

Ace Your Homework with AI
Get the answers you need in no time with our AI-driven, step-by-step assistance
Get Started


