Answered step by step
Verified Expert Solution
Question
1 Approved Answer
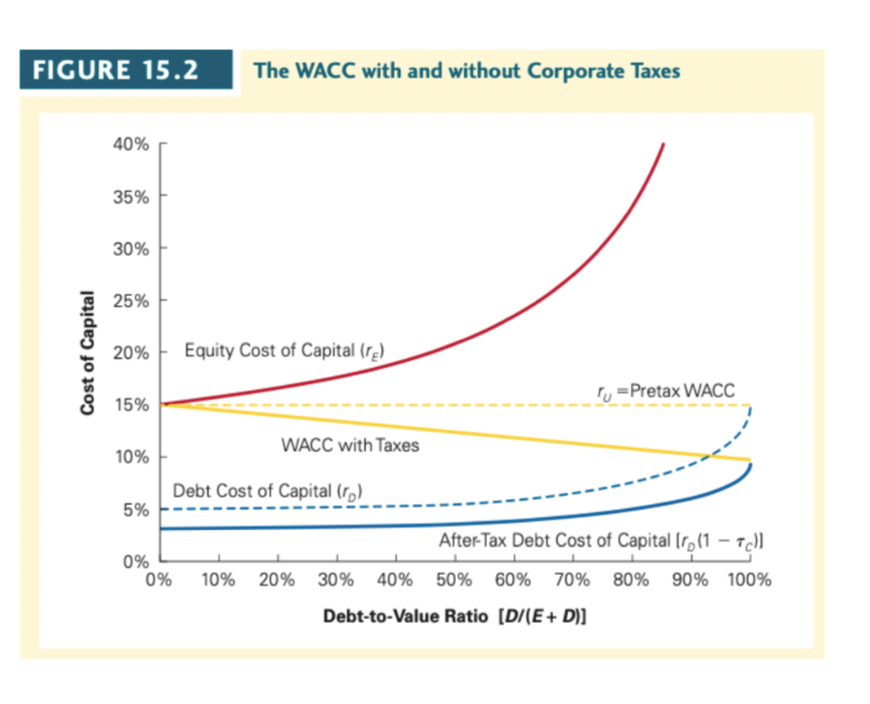
CAN YOU EXPLAIN THIS FIGURE? FIGURE 15.2 The WACC with and without Corporate Taxes 40% 35% 30% 25% Cost of Capital 20% Equity Cost of
CAN YOU EXPLAIN THIS FIGURE?
Step by Step Solution
There are 3 Steps involved in it
Step: 1

Get Instant Access to Expert-Tailored Solutions
See step-by-step solutions with expert insights and AI powered tools for academic success
Step: 2

Step: 3

Ace Your Homework with AI
Get the answers you need in no time with our AI-driven, step-by-step assistance
Get Started


