

Answered step by step
Verified Expert Solution
Question
1 Approved Answer
Can You give step by step solution We were supposed to create a new chart like on page 3, redoing the customer service cost, cust
Can You give step by step solution
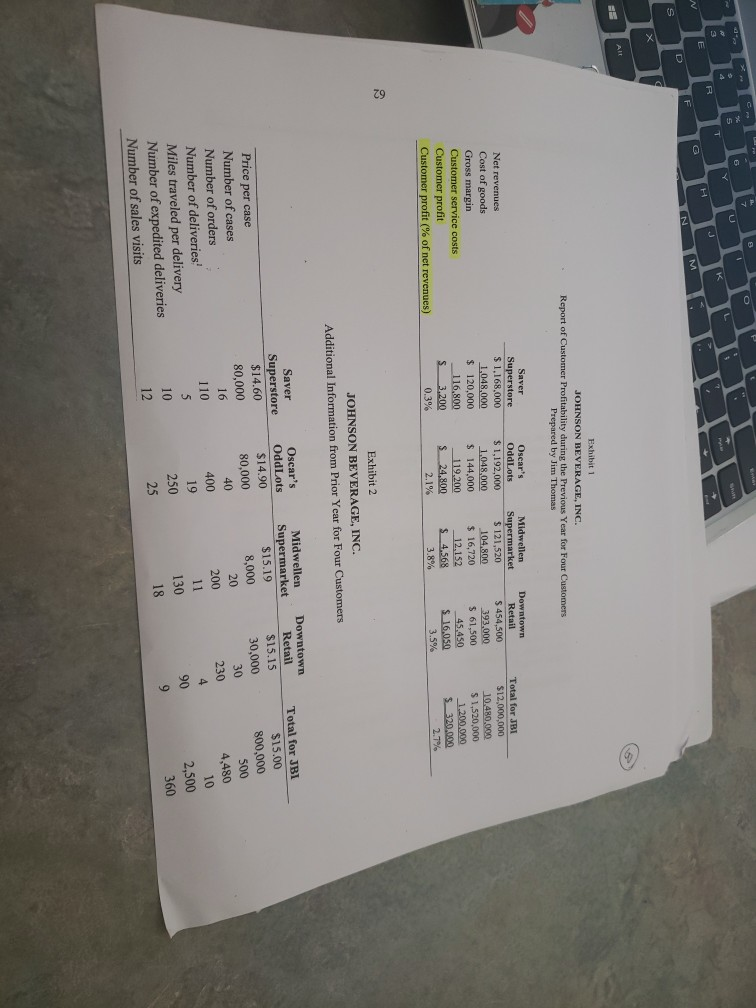
We were supposed to create a new chart like on page 3, redoing the customer service cost, cust profit and cust profit % parts.
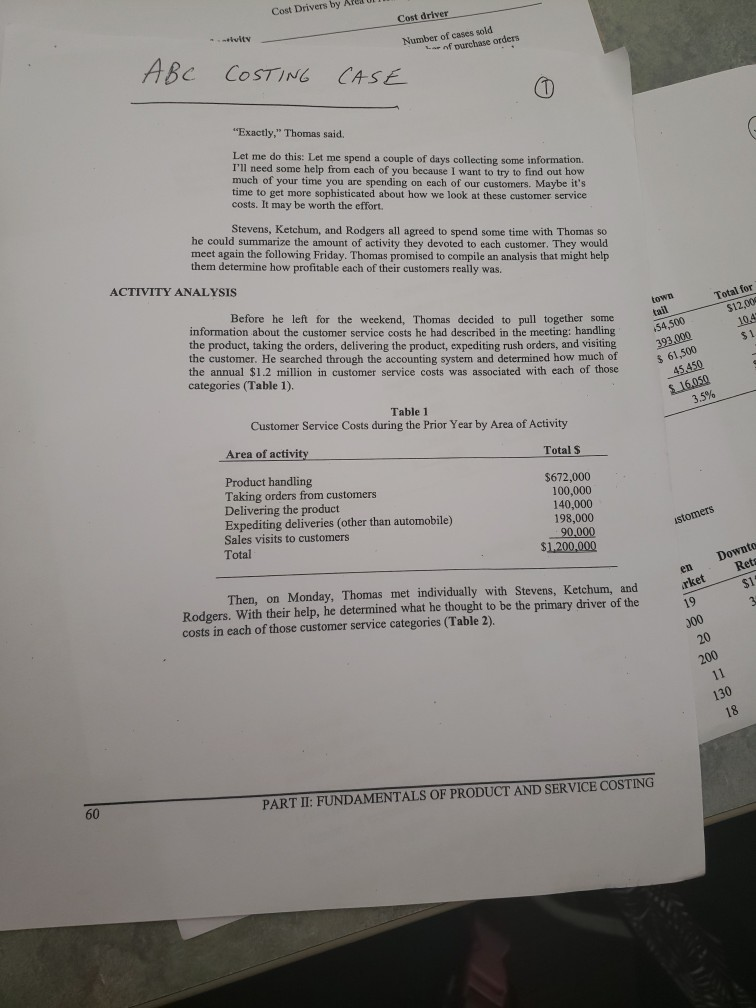
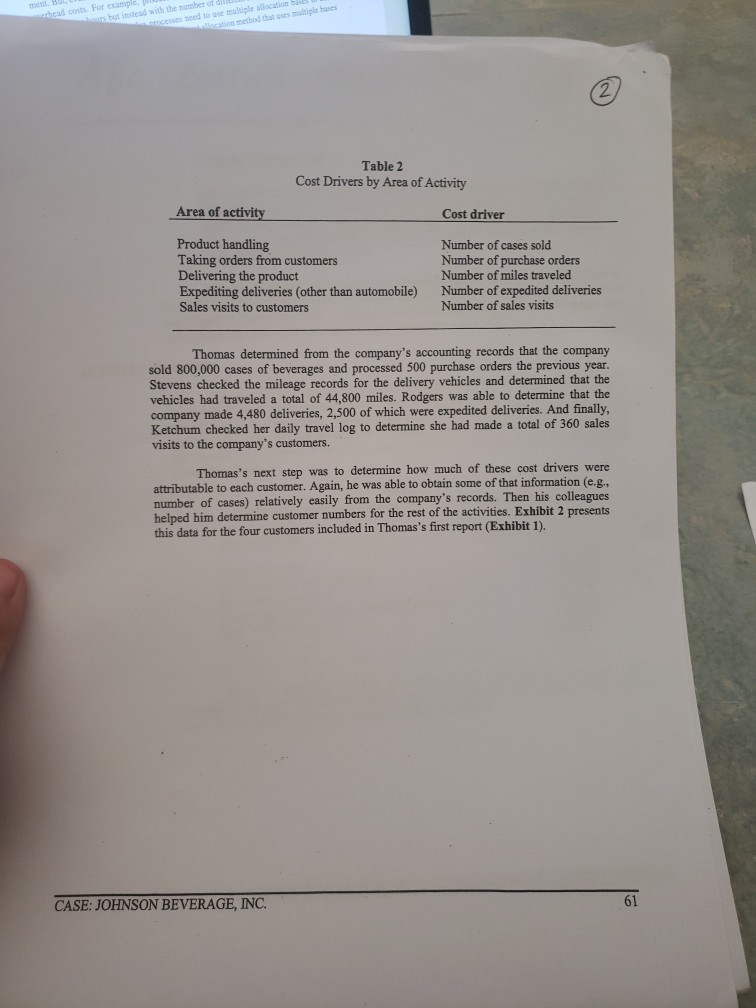
Cost Drivers by Afedi Cost driver lvity ABc COSTING CASE Number of cases sold nf purchase orders "Exactly," Thomas said. Let me do this: Let me spend a couple of days collecting some information. I'll need some help from each of you because I want to try to find out how much of your time you are spending on each of our customers. Maybe it's time to get more sophisticated about how we look at these customer service costs. It may be worth the effort. Stevens, Ketchum, and Rodgers all agreed to spend some time with Thomas so he could summarize the amount of activity they devoted to each customer. They would meet again the following Friday. Thomas promised to compile an analysis that might help them determine how profitable each of their customers really was. ACTIVITY ANALYSIS Before he left for the weekend, Thomas decided to pull together some information about the customer service costs he had described in the meeting: handling the product, taking the orders, delivering the product, expediting rush orders., and visiting the customer. He searched through the accounting system and determined how much of the annual $1.2 million in customer service costs was associated with each of those categories (Table 1). town tail Total for $12.008 10.45 $1 54,500 393,000 s 61,500 45.450 S16,050 3,5% Table 1 Customer Service Costs during the Prior Year by Area of Activity Area of activity Product handling Taking orders from customers Delivering the product Expediting deliveries (other than automobile) Sales visits to customers Total Total S $672,000 100,000 140,000 198,000 90,000 $1,200,000 Then, on Monday, Thomas met individually with Stevens, Ketchum, and Rodgers. With their help, he determined what he thought to be the primary driver of the Astomers Downto Rets en costs in each of those customer service categories (Table 2). rket $1 19 J00 20 200 11 130 18. 60 PART II: FUNDAMENTALS OF PRODUCT AND SERVICE COSTING ocesses need to use maltiple allocation blel i tion method that uses maltiple bases ment erhcad costs. For example, but instead with the number of di Table 2 Cost Drivers by Area of Activity Area of activity Cost driver Product handling Taking orders from customers Delivering the product Expediting deliveries (other than automobile) Sales visits to customers Number of cases sold Number of purchase orders Number of miles traveled Number of expedited deliveries Number of sales visits Thomas determined from the company's accounting records that the company sold 800,000 cases of beverages and processed 500 purchase orders the previous year. Stevens checked the mileage records for the delivery vehicles and determined that the vehicles had traveled a total of 44,800 miles. Rodgers was able to determine that the company made 4,480 deliveries, 2,500 of which were expedited deliveries. And finally, Ketchum checked her daily travel log to determine she had made a total of 360 sales visits to the company's customers. Thomas's next step was to determine how much of these cost drivers were attributable to each customer. Again, he was able to obtain some of that information (e.g., number of cases) relatively easily from the company's records. Then his colleagues helped him determine customer numbers for the rest of the activities. Exhibit 2 presents. this data for the four customers included in Thomas's first report (Exhibit 1) 61 CASE: JOHNSON BEVERAGE, INC. 7 e LA 3 L. K .. D M N Alt Exhibit 1 JOHNSON BEVERAGE, INC. Report of Customer Profitability during the Previous Year for Four Customers Prepared by Jim Thomas Saver Oscar's Midwellen Downtown Superstore Net revenues OddLots Supermarket Retail Total for JBI Cost of goods $1,168,000 $1,192,000 S121,520 S 454,500 $12,000,000 Gross margin 1,048,000 1.048,000 S 144,000 119.200 S 24.800 104,800 $ 16,720 12.152 S4.568 393,000 $ 61,500 10.480,000 S 1,520,000 1200.000 S 320.000 2.7 % $ 120,000 Customer service costs 116.800 Customer profit 45.450 S 3,200 Customer profit (% of net revenues) S 16,050 0.3% 2.1% 3.8% 3.5% g9 Exhibit 2 JOHNSON BEVERAGE, NC. Additional Information from Prior Year for Four Customers Oscar's OddLots Midwellen Supermarket Downtown Retail Saver Total for JB Superstore $14.60 Price per case $14.90 $15.19 $15.15 $15.00 Number of cases 80,000 80,000 8,000 30,000 800,000 Number of orders 16 40 20 30 500 400 200 230 4,480 Number of deliveries Miles traveled per delivery 110 5 19 11 10 10 250 130 90 2,500 Number of expedited deliveries 12 25 18 360 Number of sales visitsStep by Step Solution
There are 3 Steps involved in it
Step: 1

Get Instant Access to Expert-Tailored Solutions
See step-by-step solutions with expert insights and AI powered tools for academic success
Step: 2

Step: 3
Ace Your Homework with AI
Get the answers you need in no time with our AI-driven, step-by-step assistance
Get Started
Payroll Accounting
Authors: Bernard J. Bieg, Judith A. Toland
2013 edition
113396253X, 978-1133962533