

Answered step by step
Verified Expert Solution
Question
1 Approved Answer
Can you guys show me how to do this question step-by-step? Thank you! B2. You've been provided with the following data, covering one year, concerning
Can you guys show me how to do this question step-by-step? Thank you!
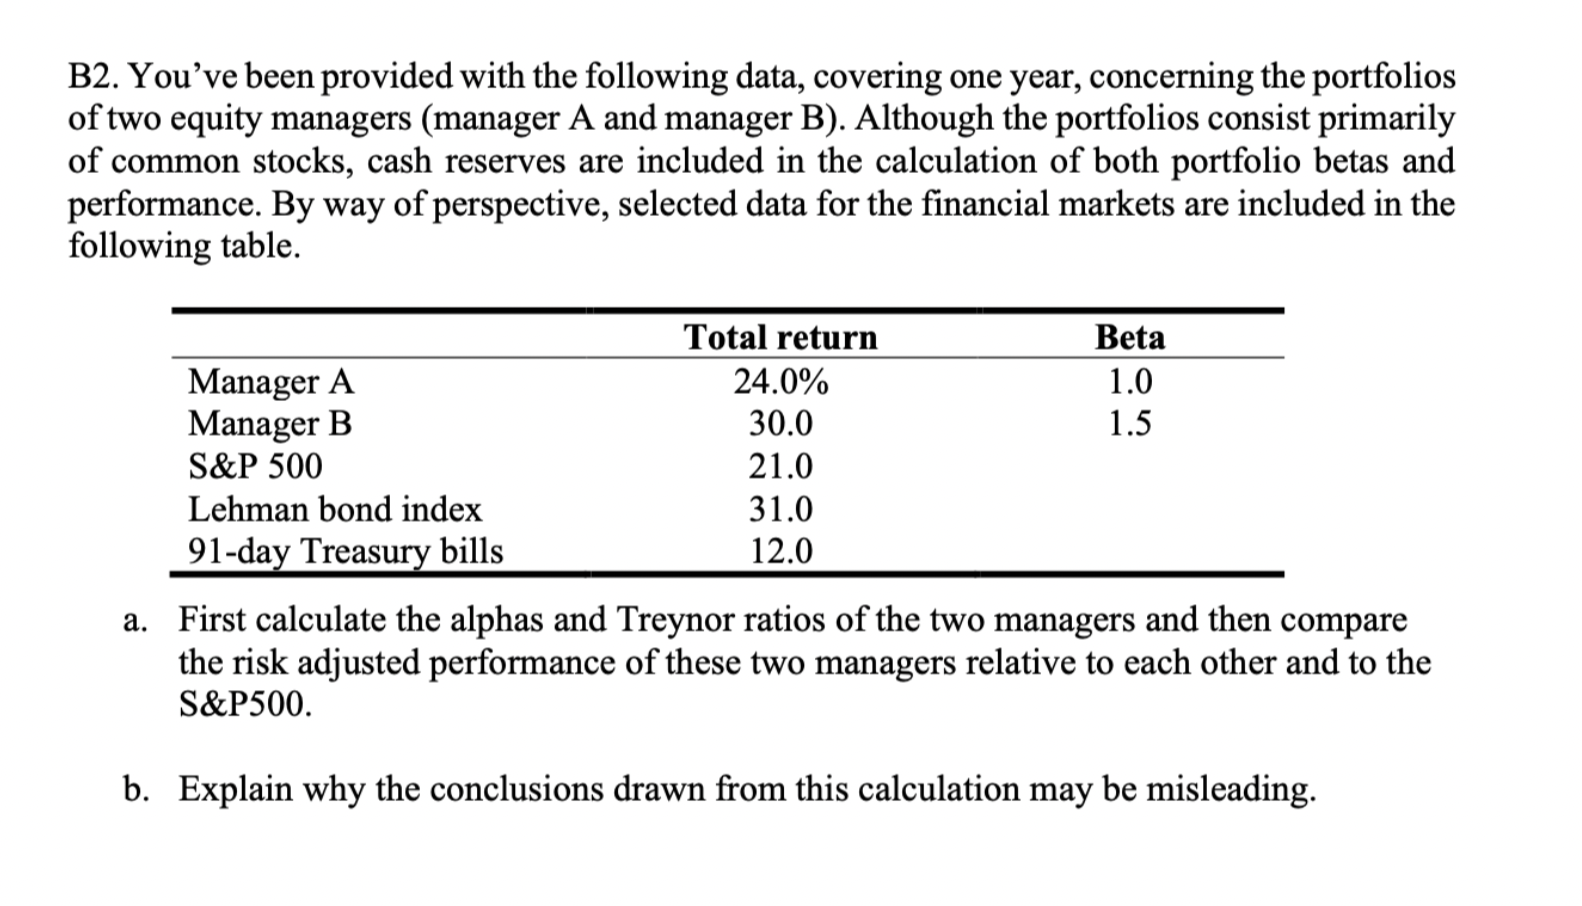
B2. You've been provided with the following data, covering one year, concerning the portfolios of two equity managers (manager A and manager B). Although the portfolios consist primarily of common stocks, cash reserves are included in the calculation of both portfolio betas and performance. By way of perspective, selected data for the financial markets are included in the following table. Total return Beta Manager A 24.0% 1.0 Manager B 30.0 1.5 S&P 500 21.0 Lehman bond index 31.0 91-day Treasury bills 12.0 a. First calculate the alphas and Treynor ratios of the two managers and then compare the risk adjusted performance of these two managers relative to each other and to the S&P500. b. Explain why the conclusions drawn from this calculation may be misleadingStep by Step Solution
There are 3 Steps involved in it
Step: 1

Get Instant Access to Expert-Tailored Solutions
See step-by-step solutions with expert insights and AI powered tools for academic success
Step: 2

Step: 3
Ace Your Homework with AI
Get the answers you need in no time with our AI-driven, step-by-step assistance
Get Started
The Ages Of The Investor A Critical Look At Life Cycle Investing
Authors: William J Bernstein
1st Edition
1478227133, 978-1478227137