

Answered step by step
Verified Expert Solution
Question
1 Approved Answer
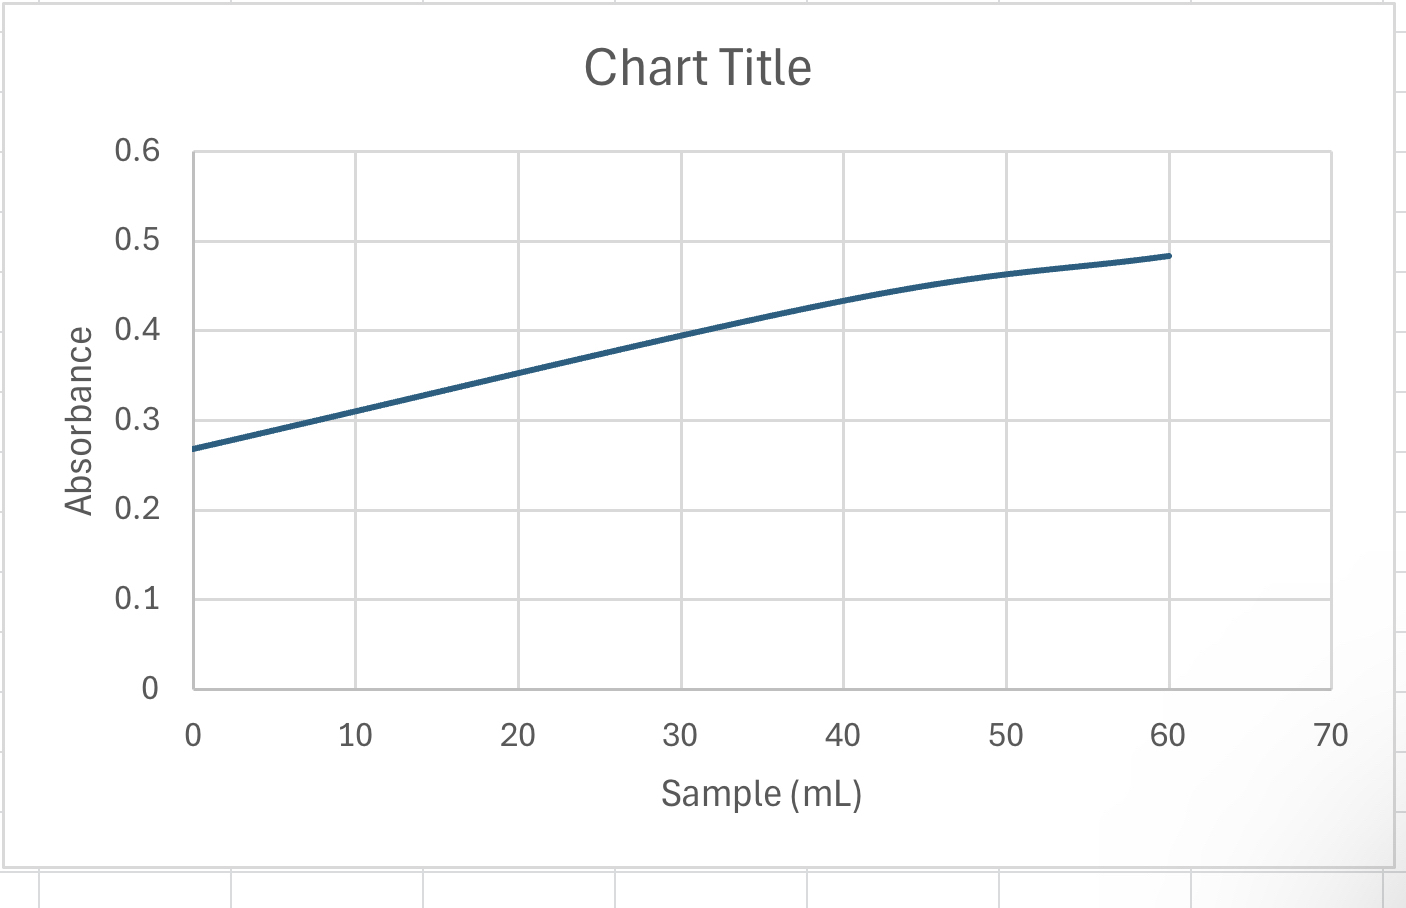
Can you help me ? Am i ploting it correctly? Im confused on how to plot tge absorbance vs spiked concentration 6 Fine powder beans
Can you help me Am i ploting it correctly?
Im confused on how to plot tge absorbance vs spiked concentration
Fine powder beans : g
Blank: abs abs
Average:
ml: abS. abs
Average: abs
ml: abs abs
Average: abs
Prsent the data table samples and absornace
Plot the absorbance vs spiked concentration mL unk spiked different volumes of standard
Measurement of Zinc in Foods by Graphite Furnace Atomic Absorption Spectrometry
Objectives:
The principle behind atomic absorption AA spectrometry.
Application of the method of standard addition.
Solid sample digestion process.
Instrumentation:
A Shimatzu Atomic Absorption Spectrometer will be used for all the analyses. The use of an autosampler can greatly enhance the sample throughput.
Principles:
Graphite furnace atomic absorption spectrometry GFAAS is a type of optical spectrometry that uses a graphitecoated furnace to vaporize the sample and measure the light absorbance of the analytes in the gas phase. Briefly, the technique is based on the fact that free atoms will absorb light at wavelengths characteristic of the element of interest hence the name atomic absorption spectrometry Within certain limits the amount of light absorbed is linearly correlated to the analyte concentration. Free atoms of most elements can be produced from samples by the application of high temperatures. In GFAAS, samples are deposited in a small graphite or pyrolytic carboncoated graphite tube cf Figures and which can then be heated to to vaporize and atomize the analyte. The atoms absorb ultraviolet or visible light and make transitions to higher electronic energy levels. Applying the BeerLambert law directly in AA spectroscopy is difficult due to variations in the atomization efficiency from the sample matrix, and nonuniformity of concentration and path length of analyte atoms.
Compared to flame AAS, GFAAS has a higher sensitivity and only a small amount of the sample is consumed during the measurement. The figure below shows the detail of graphite furnace tube bottom and how it is mounted and aligned to the light source and the detector top
Figure Diagram for Graphite Furnace Tube Bottom and Its Placement in an Atomic Absorption Spectrometer Top
In the standard addition method, a small amount of analyte of high concentration purity is spiked added into an aliquot of the unknown sample. The unknown and the spiked unknown are then analyzed under identical experimental conditions and procedures. If the instrument response is linear over the range between the sample concentration, and the combination of sample and spike, the sample concentration can be deduced by solving equations and
Eq
Chart Title
Step by Step Solution
There are 3 Steps involved in it
Step: 1

Get Instant Access to Expert-Tailored Solutions
See step-by-step solutions with expert insights and AI powered tools for academic success
Step: 2

Step: 3
Ace Your Homework with AI
Get the answers you need in no time with our AI-driven, step-by-step assistance
Get Started
Industrial Plastics Theory And Applications
Authors: Erik Lokensgard
6th Edition
1285061233, 978-1285061238