

Question
Can you help me answer this from the descriptive analysis chart? Calculate the standard deviation for your data (25.9540659).Describe the range of values that are
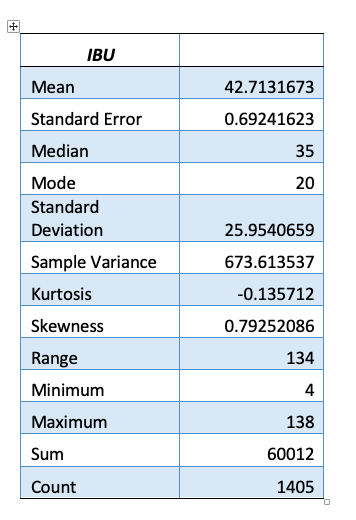
Can you help me answer this from the descriptive analysis chart? Calculate the standard deviation for your data (25.9540659).Describe the range of values that are within 3 sigma of the mean and the impact it has on the likelihood of a value being in that range in terms of the variable chosen.
Thank you.
Step by Step Solution
There are 3 Steps involved in it
Step: 1

Get Instant Access to Expert-Tailored Solutions
See step-by-step solutions with expert insights and AI powered tools for academic success
Step: 2

Step: 3
Ace Your Homework with AI
Get the answers you need in no time with our AI-driven, step-by-step assistance
Get Started
Finite Math And Applied Calculus
Authors: Stefan Waner, Steven Costenoble
7th Edition
1337515566, 9781337515566