

Question
Can you help me get this project started? My major includes graphic design but I am at a loss on this project. Please help. Thank
Can you help me get this project started? My major includes graphic design but I am at a loss on this project. Please help. Thank you
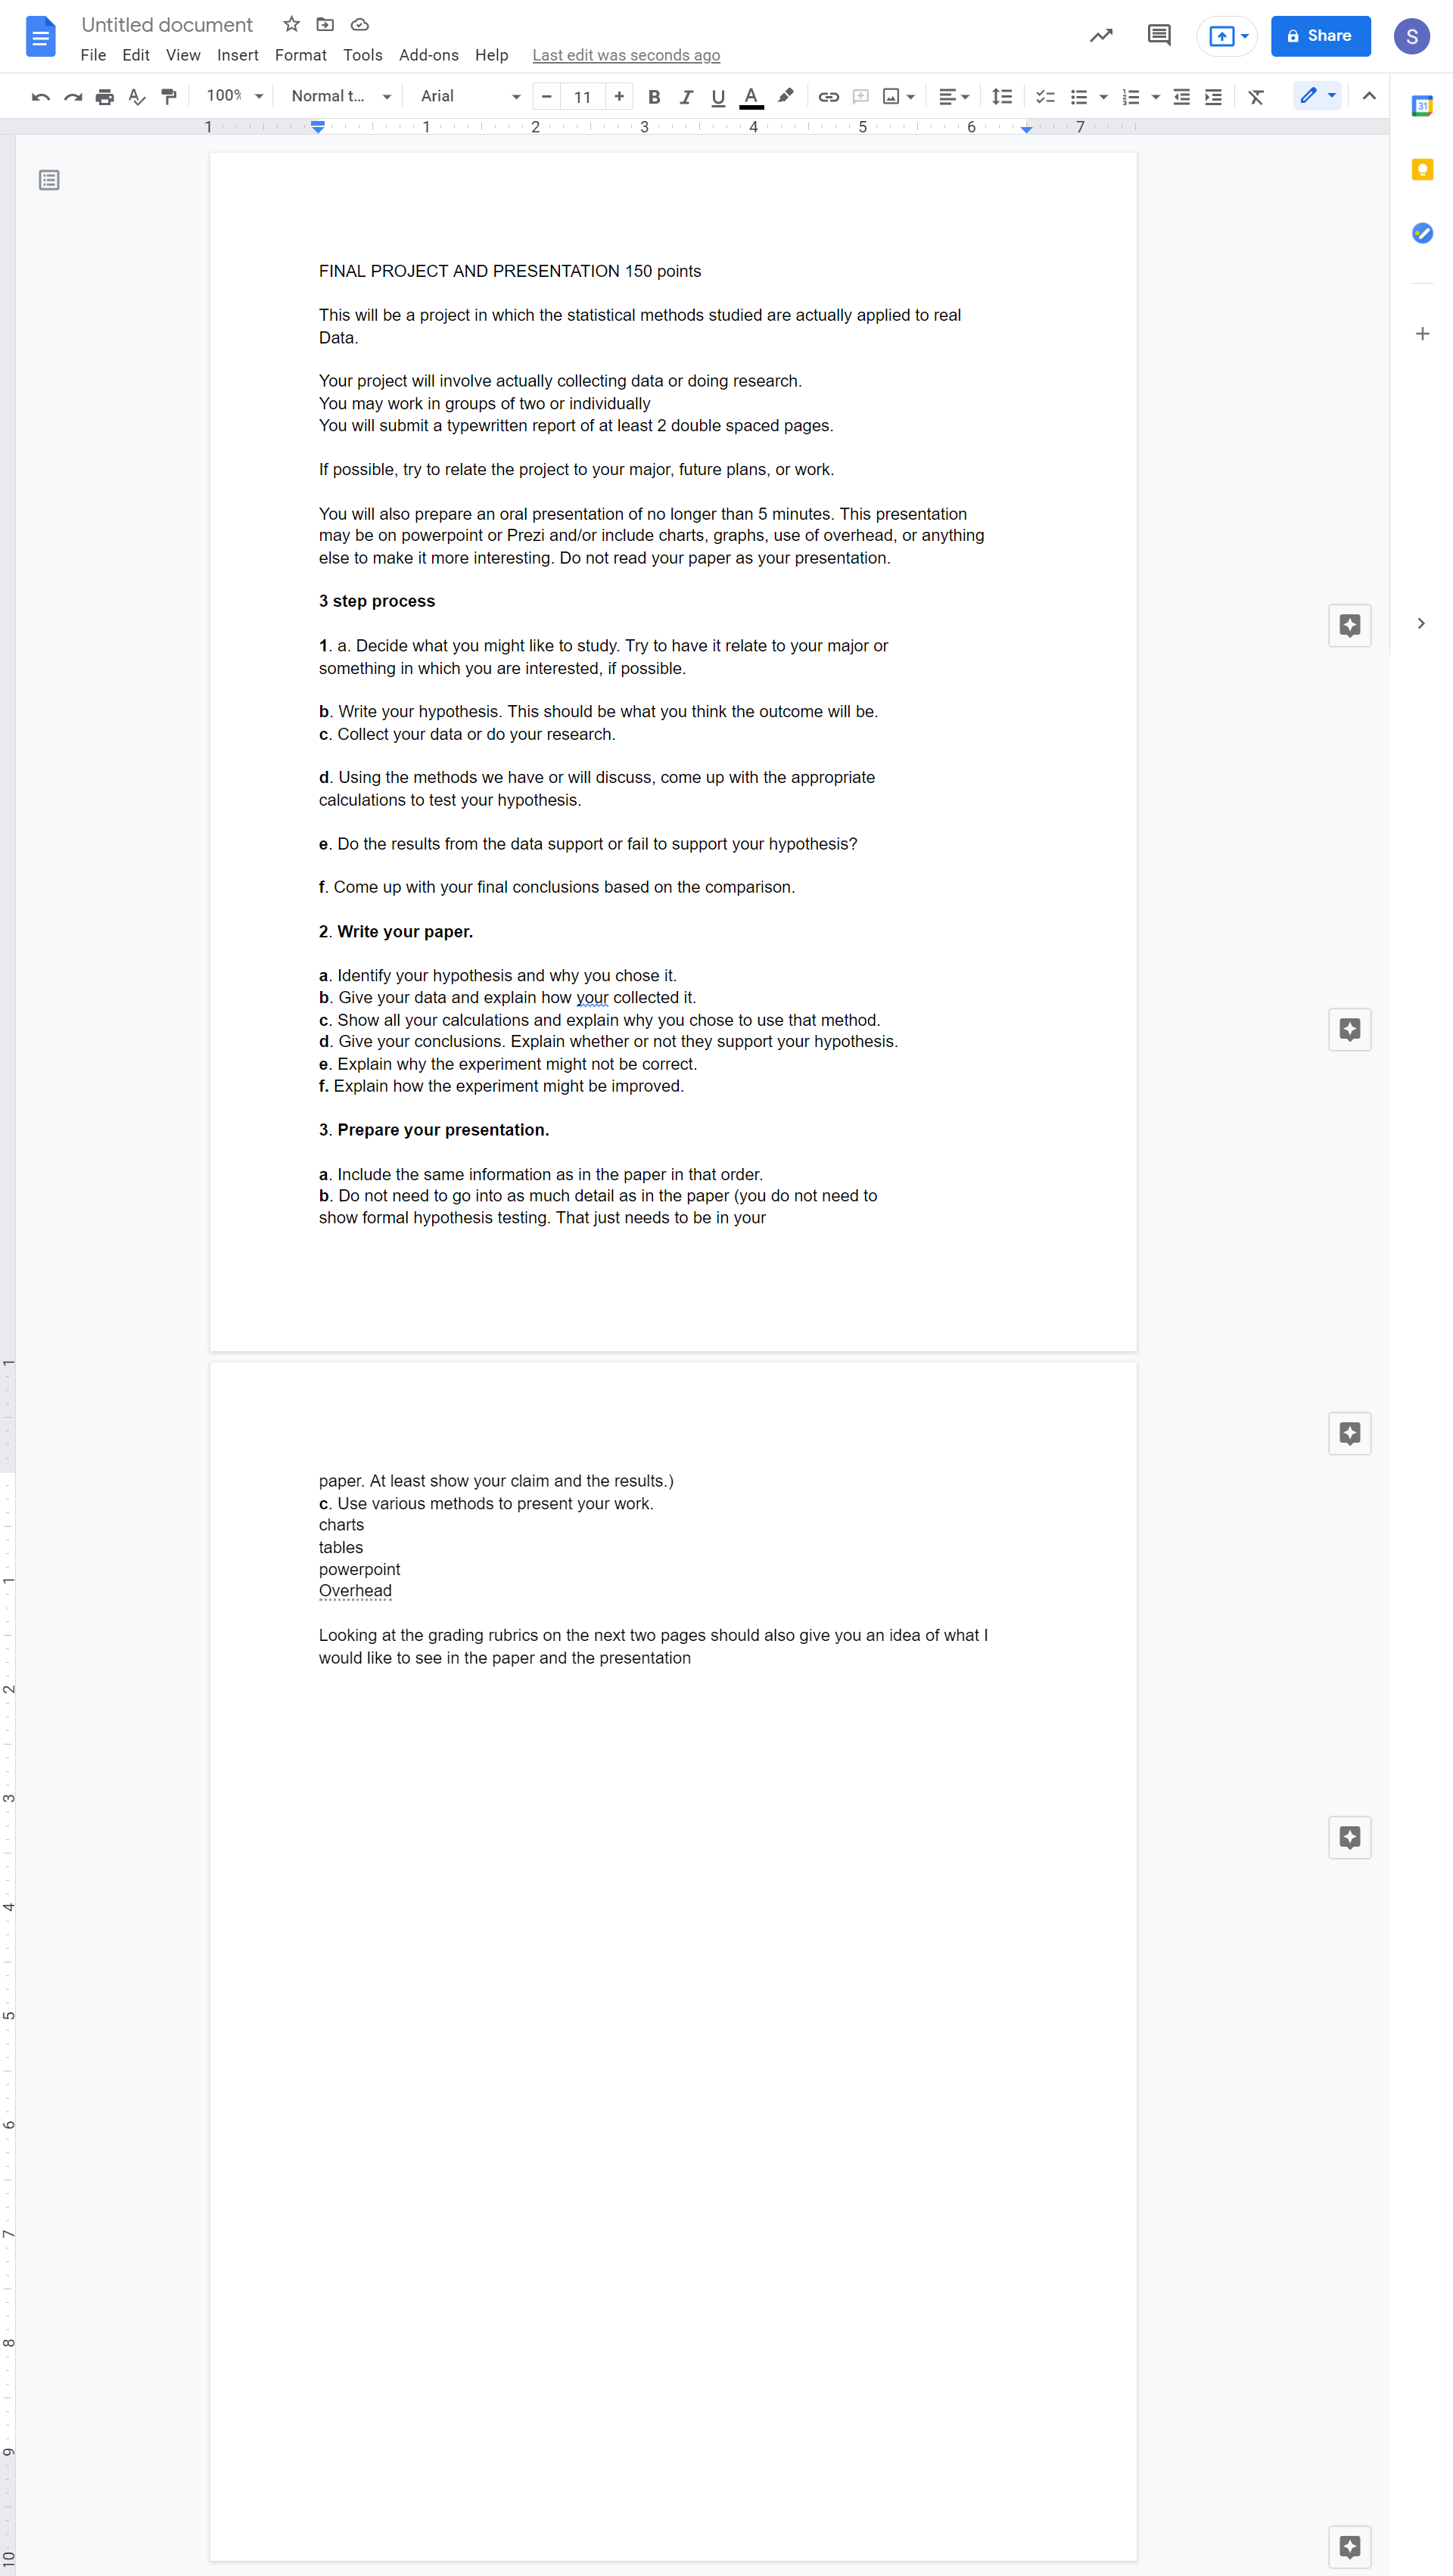
FINAL PROJECT AND PRESENTATION 150 points This will be a project in which the statistical methods studied are actually applied to real data. Your project will involve actually collecting data or doing research. You may work in groups of two or individually You will submit a typewritten report of at least 2 double spaced pages. If possible, try to relate the project to your major, future plans, or work. You will also prepare an oral presentation of no longer than 5 minutes. This presentation may be on powerpoint or Prezi and/or include charts, graphs, use of overhead, or anything else to make it more interesting. Do not read your paper as your presentation. 3 step process 1. a. Decide what you might like to study. Try to have it relate to your major or something in which you are interested, if possible. b. Write your hypothesis. This should be what you think the outcome will be. c. Collect your data or do your research. d. Using the methods we have or will discuss, come up with the appropriate calculations to test your hypothesis. e. Do the results from the data support or fail to support your hypothesis? f. Come up with your final conclusions based on the comparison. 2. Write your paper. a. Identify your hypothesis and why you chose it. b. Give your data and explain how your collected it. c. Show all your calculations and explain why you chose to use that method. d. Give your conclusions. Explain whether or not they support your hypothesis. e. Explain why the experiment might not be correct. f. Explain how the experiment might be improved. 3. Prepare your presentation. a. Include the same information as in the paper in that order. b. Do not need to go into as much detail as in the paper (you do not need to show formal hypothesis testing. That just needs to be in your paper. At least show your claim and the results.) c. Use various methods to present your work. charts tables powerpoint overhead Looking at the grading rubrics on the next two pages should also give you an idea of what I would like to see in the paper and the presentation
Step by Step Solution
There are 3 Steps involved in it
Step: 1

Get Instant Access to Expert-Tailored Solutions
See step-by-step solutions with expert insights and AI powered tools for academic success
Step: 2

Step: 3
Ace Your Homework with AI
Get the answers you need in no time with our AI-driven, step-by-step assistance
Get Started