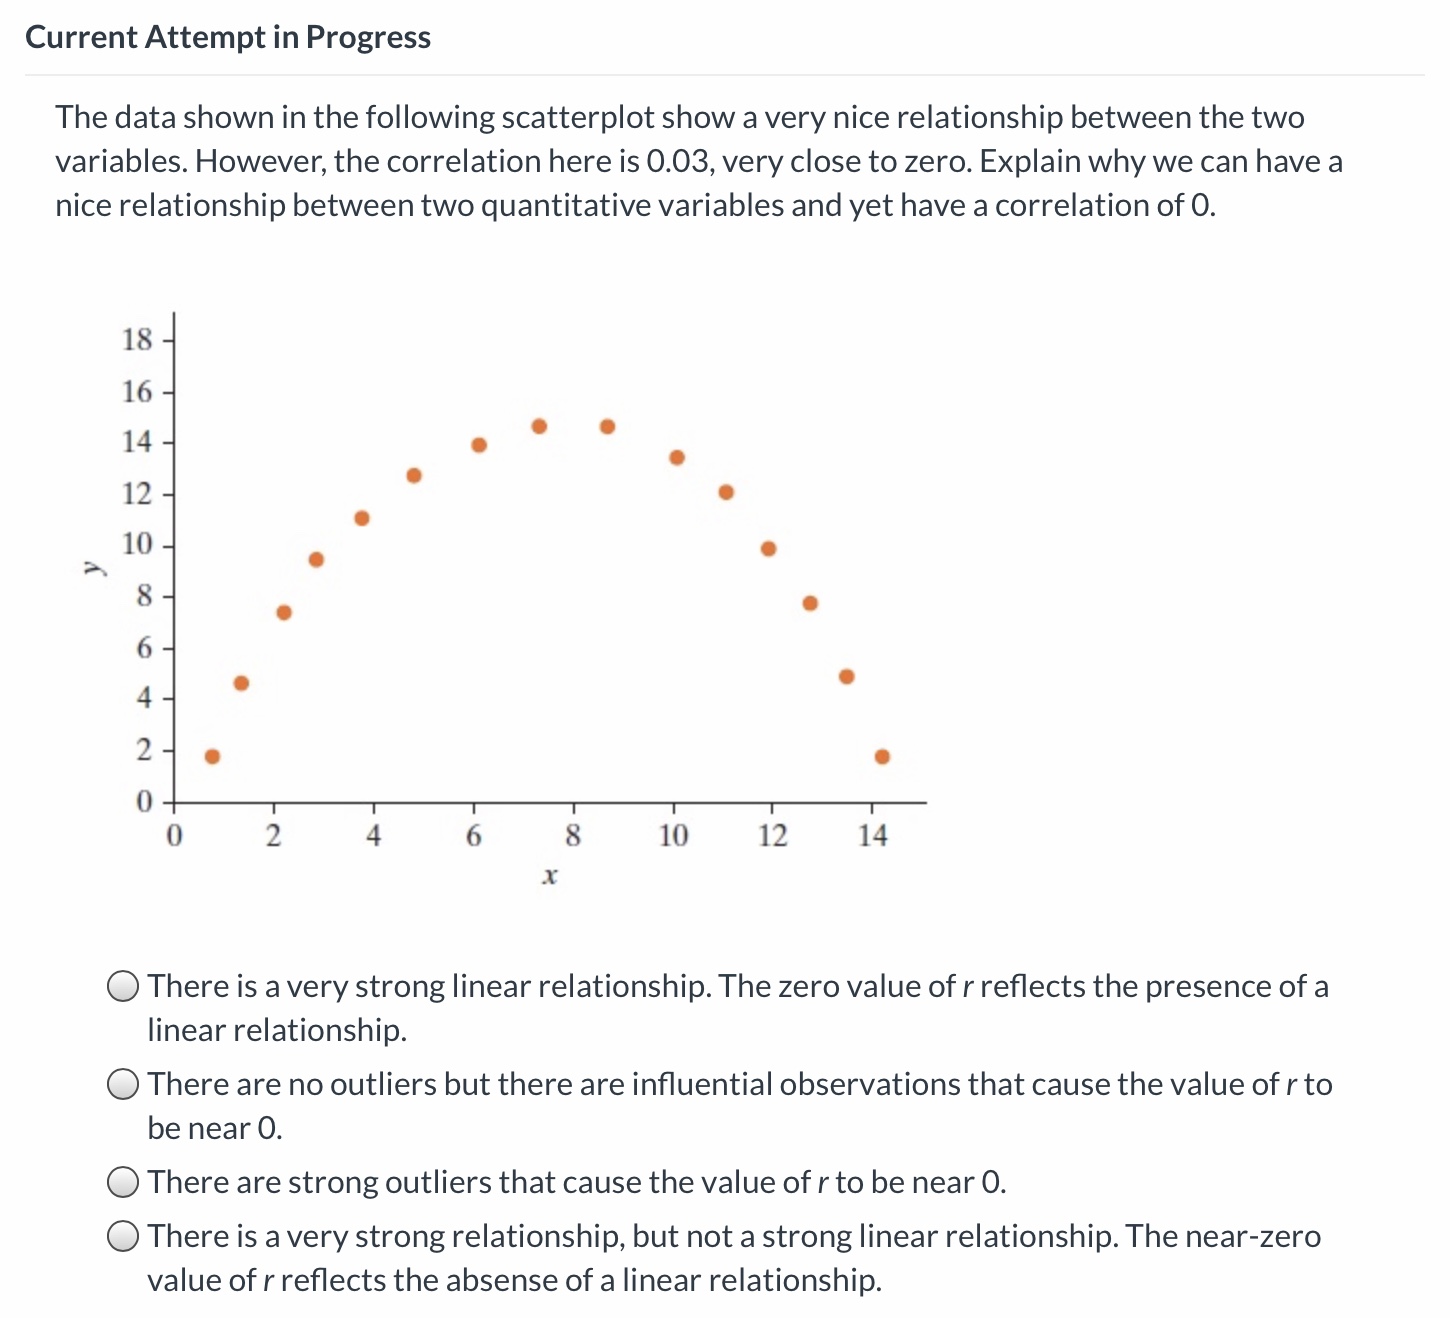
Question: Can you help me please? 1) Current Attempt in Progress The data shown in the following scatterplot show a very nice relationship between the two
Can you help me please?
1)


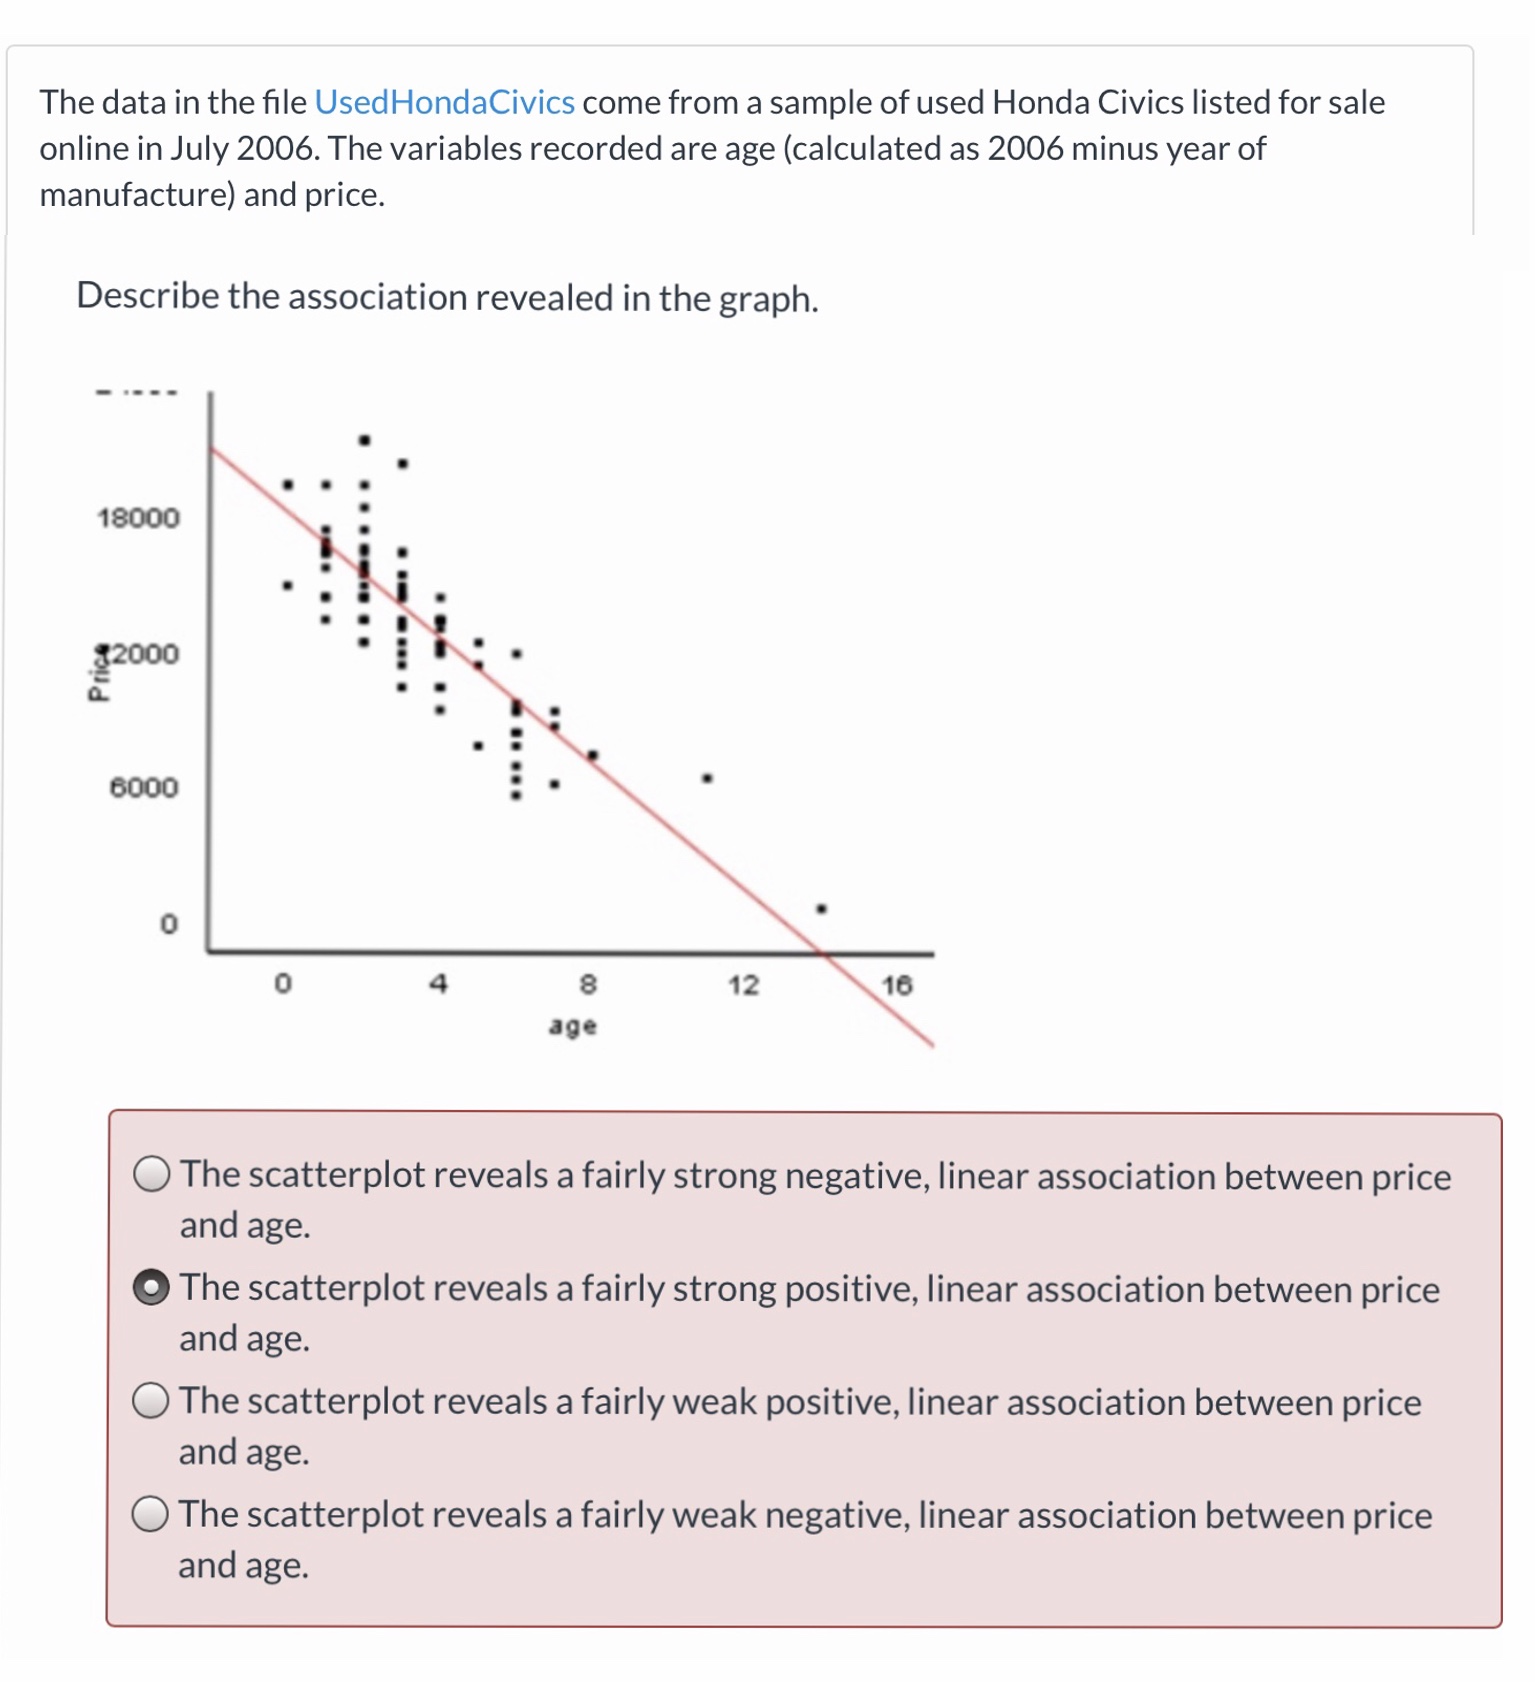
Current Attempt in Progress The data shown in the following scatterplot show a very nice relationship between the two variables. However, the correlation here is 0.03, very close to zero. Explain why we can have a nice relationship between two quantitative variables and yet have a correlation of 0. 18 - 16 - 14 12 10 - 8 6 4 . 10 12 14 X O There is a very strong linear relationship. The zero value of r reflects the presence of a linear relationship. O There are no outliers but there are influential observations that cause the value of r to be near O. O There are strong outliers that cause the value of r to be near 0. O There is a very strong relationship, but not a strong linear relationship. The near-zero value of r reflects the absense of a linear relationship.The data in the le Used HondaCivics come from a sample of used Honda Civics listed for sale online in July 2006. The variables recorded are age (calculated as 2006 minus year of manufacture) and price. Describe the association revealed in the graph. - 0... 1m O The scatterplot reveals a fairly strong negative, linear association between price and age. 0 The scatterplot reveals a fairly strong positive, linear association between price and age. 0 The scatterplot reveals a fairly weak positive, linear association between price and age. O The scatterplot reveals a fairly weak negative, linear association between price and age. Current Attempt in Progress 10.2.19la) Scrabble is a word buiding game where each letter is assigned a point value and when you spell a word you earn the total of all the points in each letter. Students were asked to nd the total value of points from the letters of their name (Scrabble points) and then divide their Scrabble points by the number of letters in their name (Scrabble points per letter). State in words the appropriate null and alternative hypotheses to test whether there is an association between the Scrabble points for a student's name and the corresponding Scrabble points per letter. O Null: There is an association between Scrabble points per letter of their names and number of letters in a name. Alternative: There is no association between Scrabble points per letter of their names and number of letters in a name. 0 Null: There is an association between Scrabble points per letter of their names and their Scrabble score. Alternative: There is no association between Scrabble points per letter of their names and their Scrabble score. O Null: There is no association between Scrabble points per letter of their names and number of letters in a name. Alternative: There is an association between Scrabble points per letter of their names and number of letters in a name. O Null: There is no association between Scrabble points per letter of their names and their Scrabble score. Alternative: There is an association between Scrabble points per letter of their names and their Scrabble score
Step by Step Solution
There are 3 Steps involved in it

Get step-by-step solutions from verified subject matter experts


